 Industrial metals surged on Wednesday with 2+ percent gains coming in silver, aluminum, palladium, copper and nickel. The Silver ETF (SLV), in particular, finally broke out of a two-month consolidation.
The chart below shows the Silver ETF (SLV) with Bollinger Bands in pink and BandWidth in the indicator window. Overall, SLV has been stuck in a large trading range the last 12 months. With today's move, the ETF surged off the mid-point of this range and the cup is now half full.
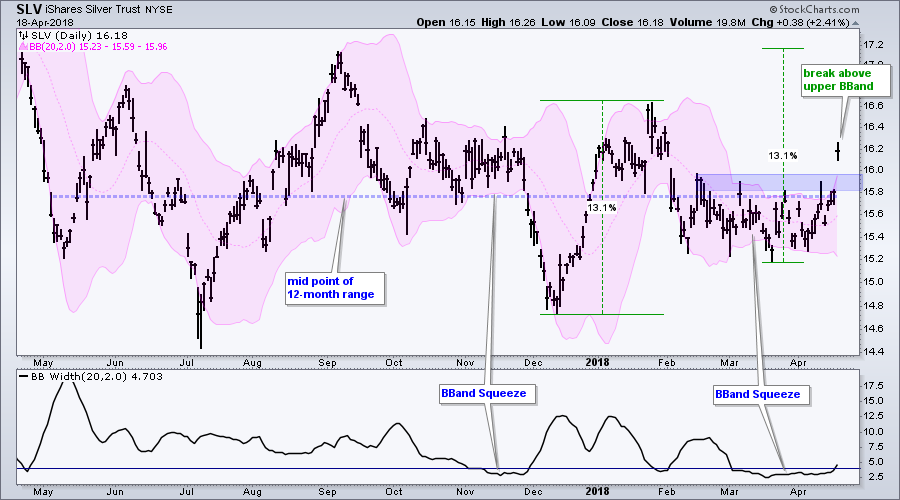 The Bollinger Bands narrowed in early March and remained tight into April. Notice that BandWidth dipped below 4% in early March and just now moved above 4%. The narrowing reflects a volatility contraction and such contractions are expected to be followed by a volatility expansion, which is happening now as the bands start to widen again.
The breakout is clearly bullish and the breakout zone in the 15.8-16 becomes first support to watch should we get a throwback. Measuring upside targets is tricky business, but a measured move would targets a move to the 17-17.2 area. The December-January advance was around 13% and a similar move could occur from the March low.
Plan Your Trade and Trade Your Plan.
- Arthur Hill, CMT
Senior Technical Analyst, StockCharts.com
Book: Define the Trend and Trade the Trend
Twitter: Follow @ArthurHill