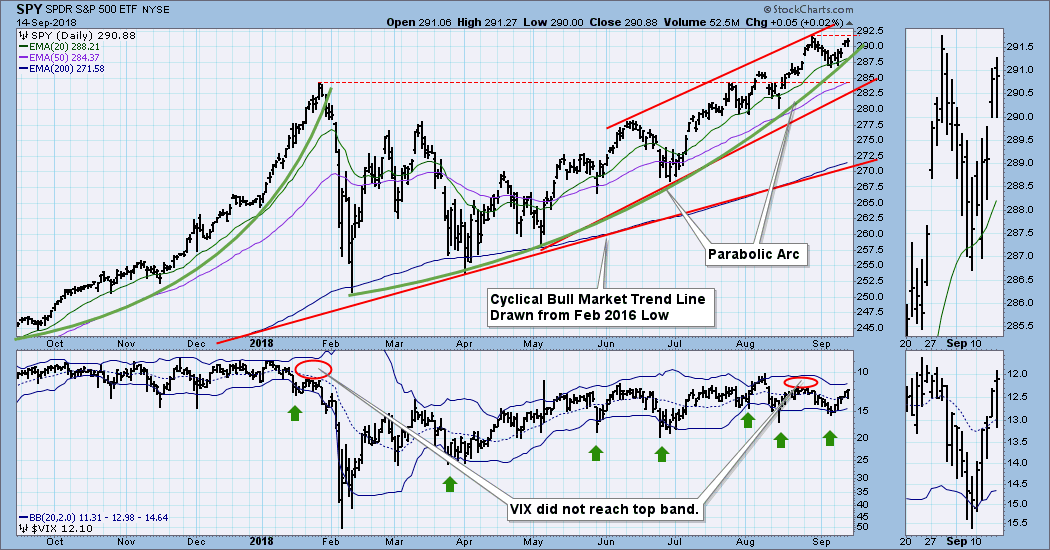
Last week I was concerned that the VIX had topped but had failed reach the top band on the chart -- a similar configuration occurred in January before the crash. This week the VIX moved close to the top of the channel, so I think we can consider that the 'gap' problem has cleared. (To clarify, I use an inverted scale for the VIX to make interpretation more intuitive, and my references are to that display.) The market is near all-time highs again, as it continues to walk up a parabolic arc.
The DecisionPoint Weekly Wrap presents an end-of-week assessment of the trend and condition of the stock market (S&P 500), the U.S. Dollar, Gold, Crude Oil, and Bonds.
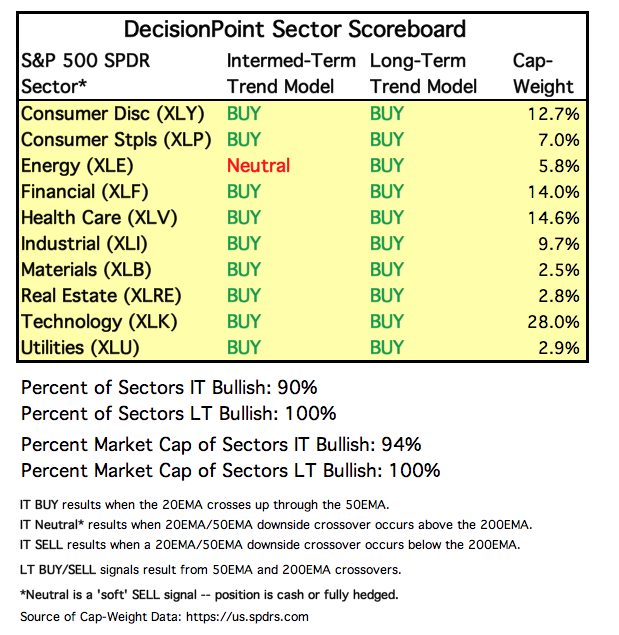
SECTORS
Each S&P 500 Index component stock is assigned to one, and only one, of 10 major sectors. This is a snapshot of the Intermediate-Term and Long-Term Trend Model signal status for those sectors.
STOCKS
IT Trend Model: BUY as of 5/11/2018
LT Trend Model: BUY as of 4/1/2016
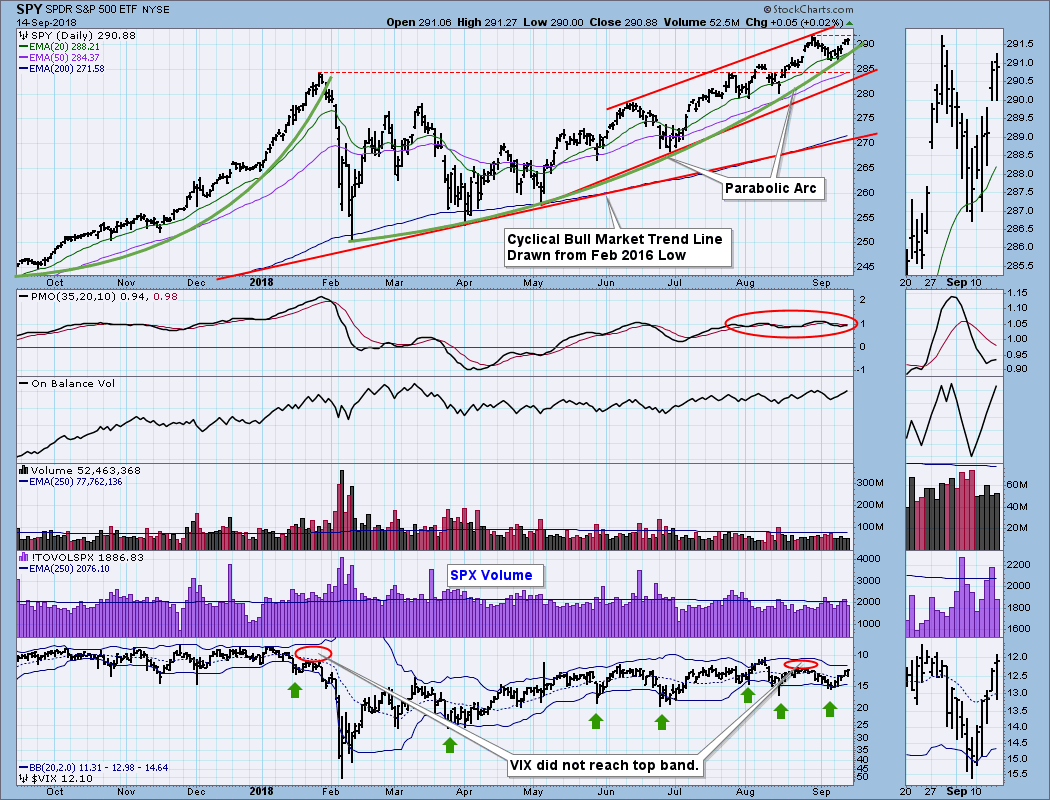
SPY Daily Chart: Price is being squeezed between a rising trend channel and a parabolic arc. To be clear, I don't really think of the arc as 'support,' rather it is just an expression of increasing investor abandon. As I have said, the arc is in early stages, and it could soon be lost to corrective action. The flat, but positive, daily PMO indicates that there is steady upward pressure on price. The VIX is near the upper band, so a short-term top could develop soon.
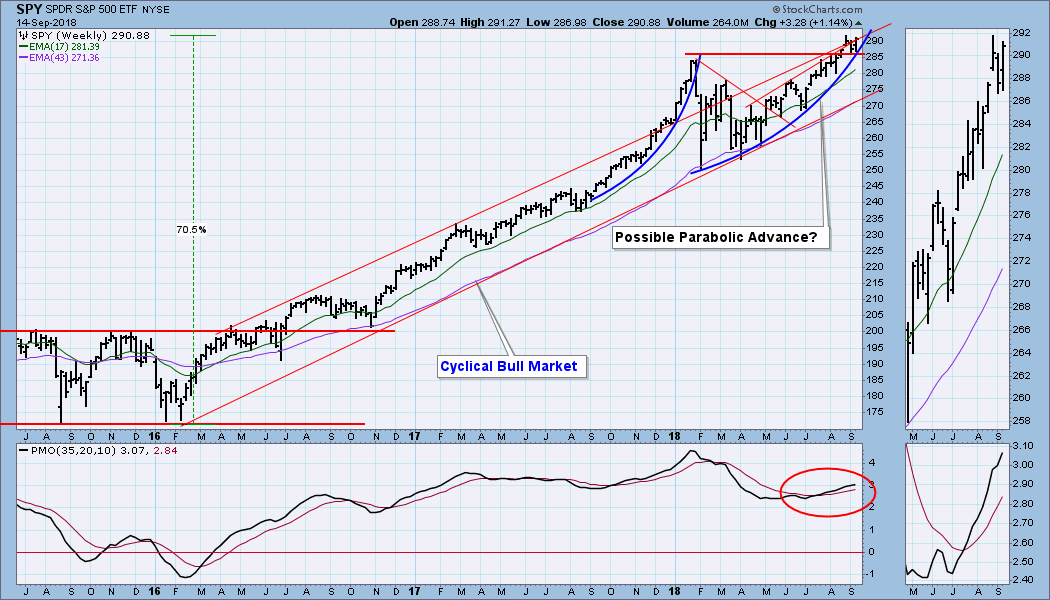
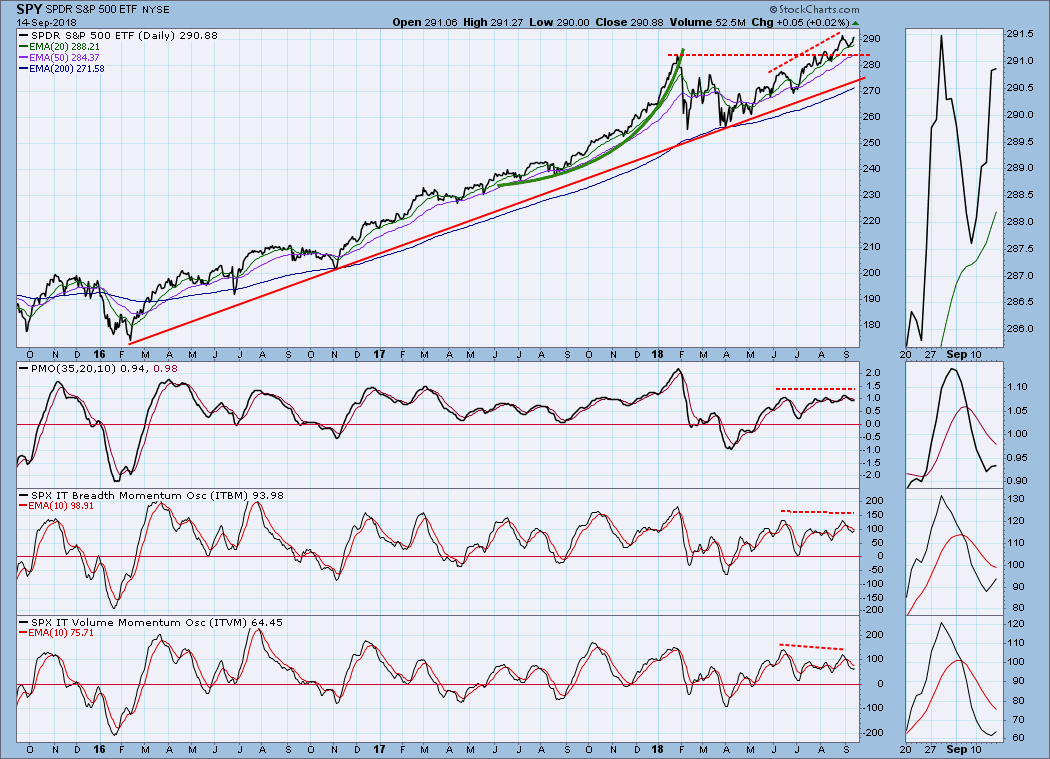
SPY Weekly Chart: My note on this chart indicates that I am still a bit tentative regarding the developing parabolic, but the cyclical bull market is certainly healthy with price being at the top of the rising trend channel.
Short-Term Market Indicators: The STO-B and STO-V are confirming the recent price advance. They could reach overbought levels next week.
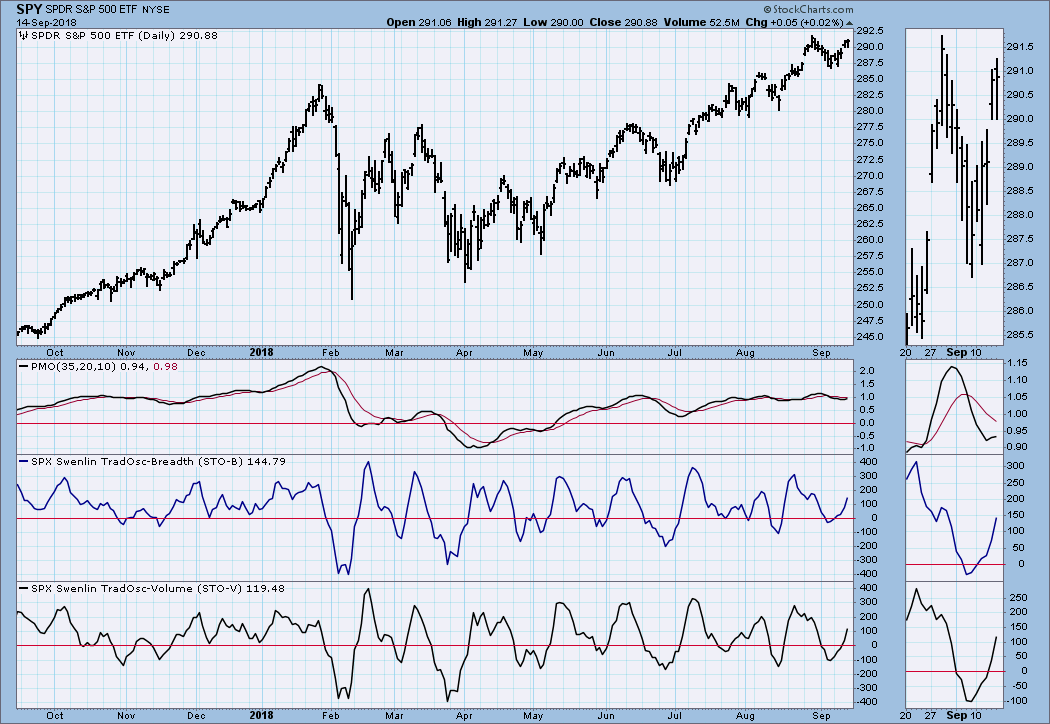
Intermediate-Term Market Indicators: Modestly overbought with negative divergences continuing.
Conclusion: The market is somewhat overbought intermediate-term, but this is more or less the condition the market has been in since June, and it hasn't stopped upward progress. Price is reaching the resistance line drawn across the August high, but we'll probably see new highs next week in spite of that. After the new highs, the VIX and short-term indicators will be overbought, and a small correction will be in order.
Next week is end of quarter options expiration, so expect very high volume on Friday and a narrow price range toward the end of the week. That is not guaranteed, but it is what we usually see.
DOLLAR (UUP)
IT Trend Model: BUY as of 4/24/2018
LT Trend Model: BUY as of 5/25/2018
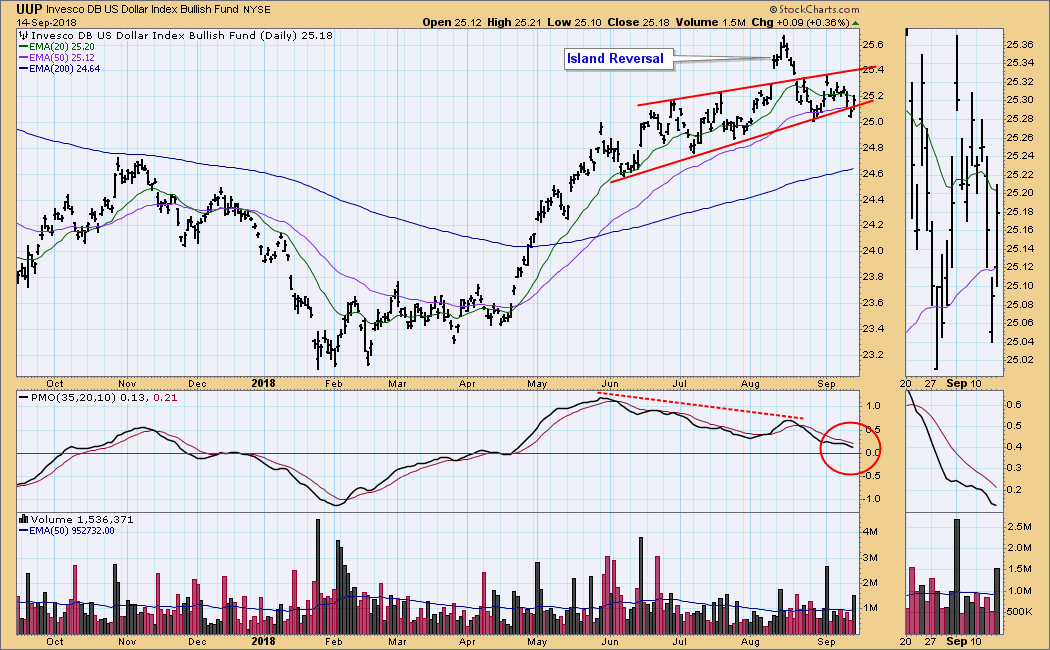
UUP Daily Chart: I am still using a rising wedge to define the chart structure, even though it is punctuated by the island reversal. Lack of forward progress has the daily PMO falling back to the zero line.
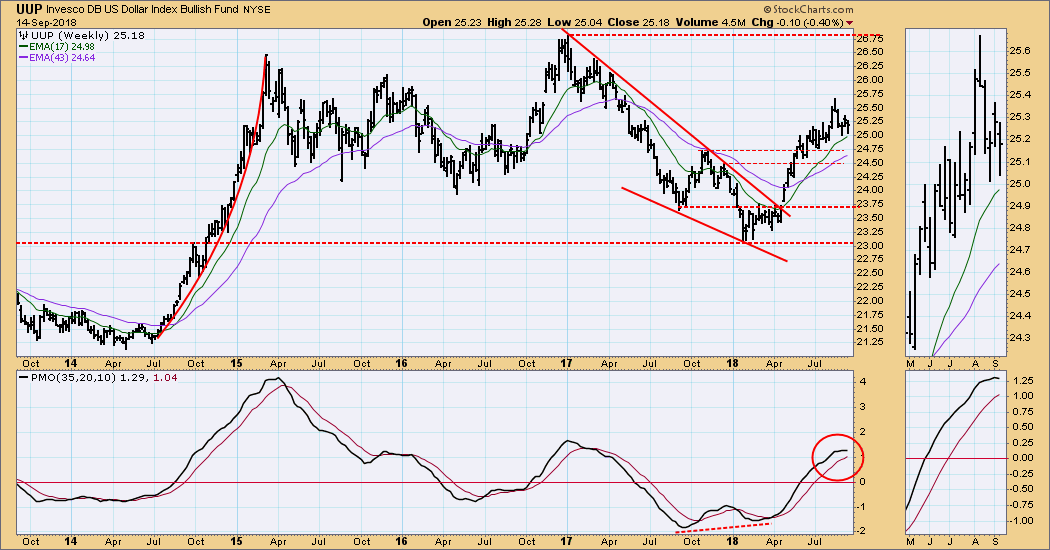
UUP Weekly Chart: Earlier this year price squirted out of a large falling wedge formation. It has since begun to decelerate, causing the weekly PMO to top this week. I think a correction is likely.
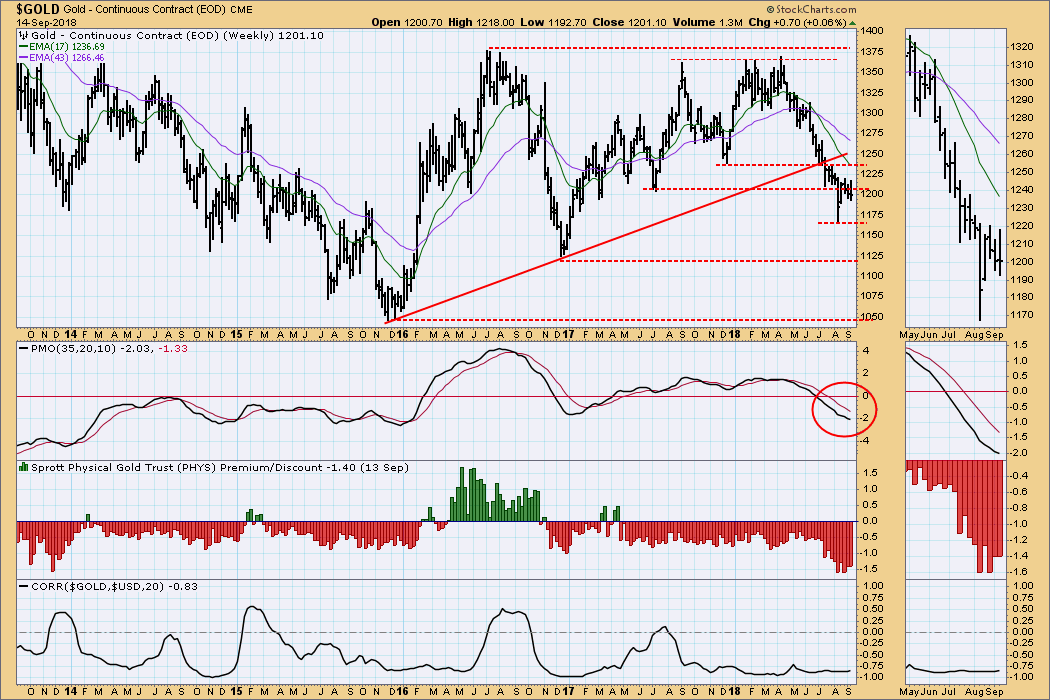
GOLD
IT Trend Model: NEUTRAL as of 5/2/2018
LT Trend Model: SELL as of 6/22/2018
GOLD Daily Chart: The bounce off the August low has turned into a consolidation, and I think there is good reason to believe that a new up trend is beginning.
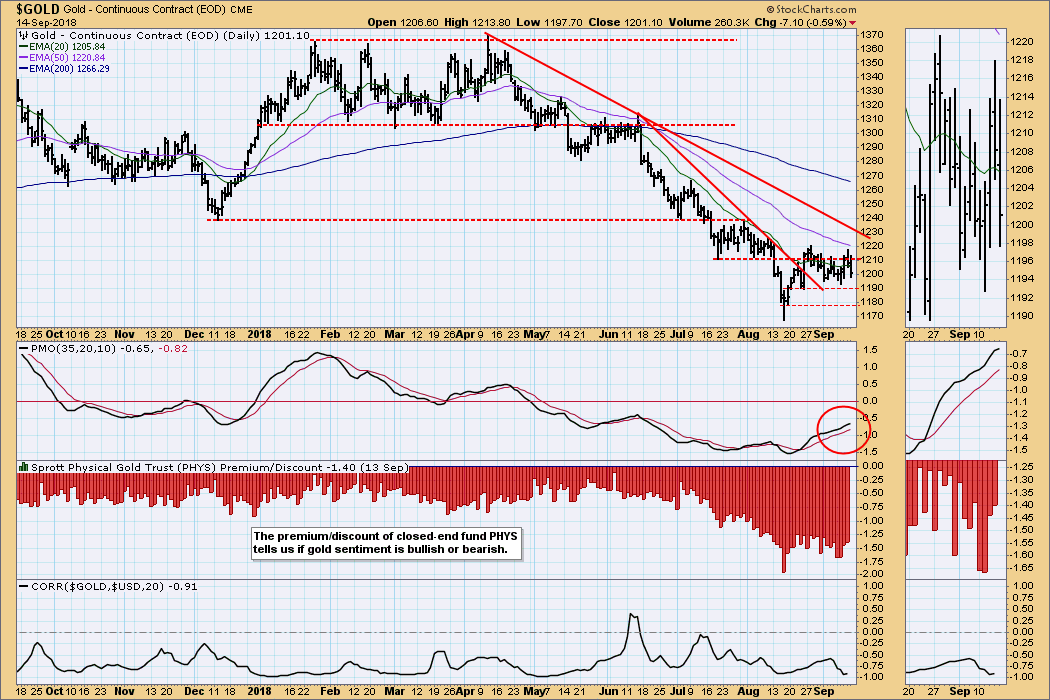
GOLD Weekly Chart: It appears that the weekly PMO is trying to bottom, which tends to reinforce the positive vibes I'm getting from the daily chart.
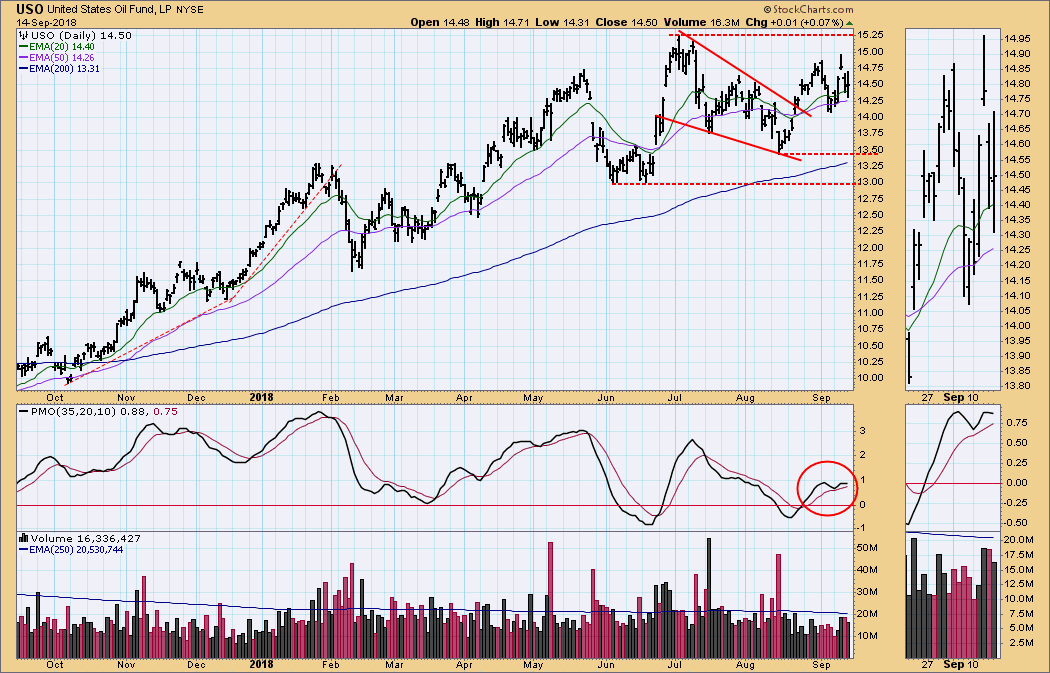
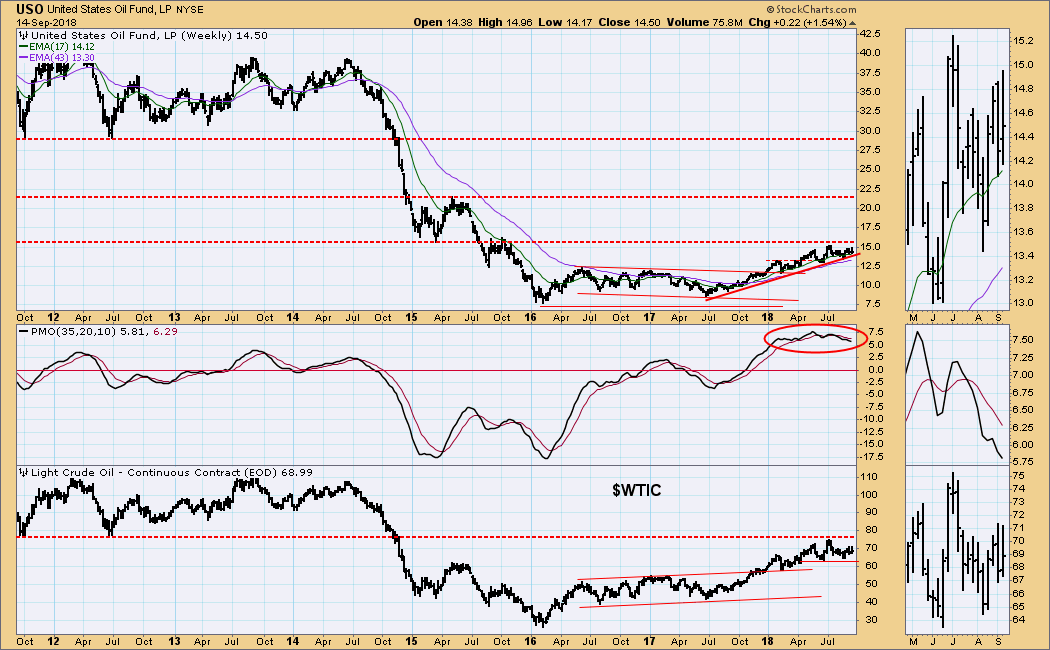
CRUDE OIL (USO)
IT Trend Model: BUY as of 8/24/2018
LT Trend Model: BUY as of 11/2/2017
USO Daily Chart: USO seems to be settling into a trading range, the consequence of which is four IT Trend Model changes in three months. The short-term PMO double top implies some weakness ahead.
USO Weekly Chart: USO is getting squeezed between the rising trend line and the overhead resistance. As for $WTIC, it is possible it is beginning a sideways range between 63 and 76, which would translate to something similar with USO.
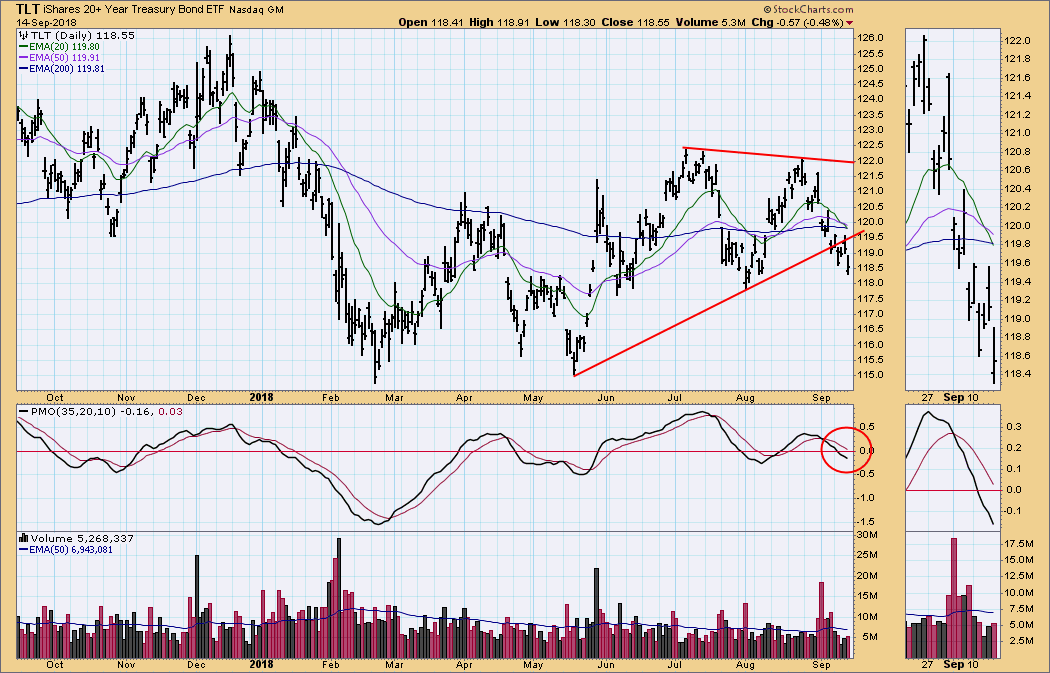
BONDS (TLT)
IT Trend Model: NEUTRAL as of 9/13/2018
LT Trend Model: BUY as of 8/20/2018
TLT Daily Chart: On Thursday the IT Trend Model changed from BUY to NEUTRAL. Thanks to primarily sideways price movement, this was the ninth signal change in a year, and the sixth in six months. The EMAs are so close together that next week I expect to see the fifth LT Trend Model signal change (to SELL) in a year. While the Trend Models are reliable tools, there surely could be no better illustration of their weakness.
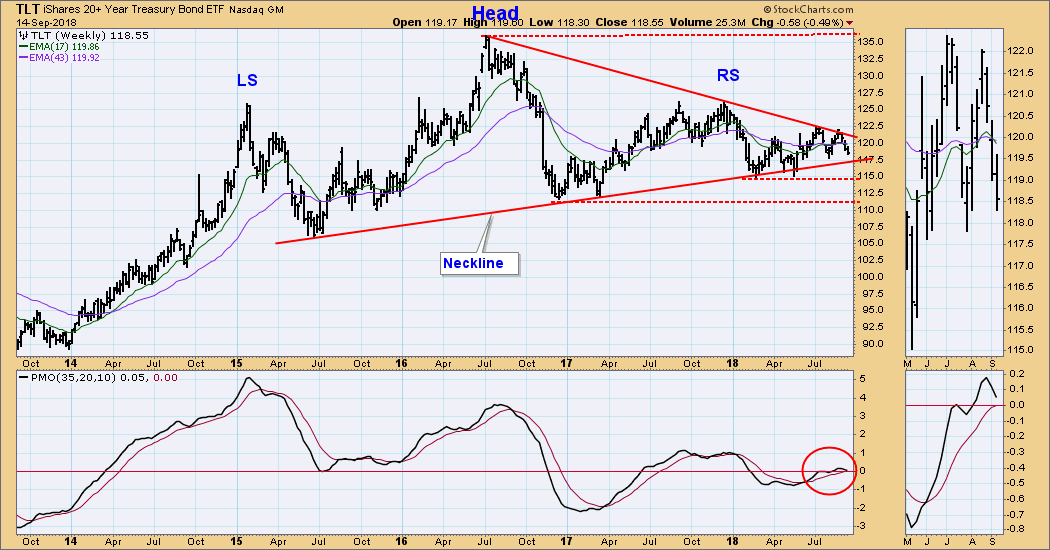
TLT Weekly Chart: The head and shoulders pattern I have annotated is still viable, and the current weekly PMO configuration indicates to me that a breakdown is likely.
**Don't miss any of the DecisionPoint commentaries! Go to the "Notify Me" box toward the end of this blog page to be notified as soon as they are published.**
Technical Analysis is a windsock, not a crystal ball.
Happy Charting!
- Carl
NOTE: The signal status reported herein is based upon mechanical trading model signals, specifically, the DecisionPoint Trend Model. They define the implied bias of the price index based upon moving average relationships, but they do not necessarily call for a specific action. They are information flags that should prompt chart review. Further, they do not call for continuous buying or selling during the life of the signal. For example, a BUY signal will probably (but not necessarily) return the best results if action is taken soon after the signal is generated. Additional opportunities for buying may be found as price zigzags higher, but the trader must look for optimum entry points. Conversely, exit points to preserve gains (or minimize losses) may be evident before the model mechanically closes the signal.
Helpful DecisionPoint Links:
DecisionPoint Shared ChartList and DecisionPoint Chart Gallery
Price Momentum Oscillator (PMO)
Swenlin Trading Oscillators (STO-B and STO-V)