I normally expect options expiration week to be dull, and with this week's range of less than one percent, I was not disappointed. I was also looking for a short-term pullback, but that did not materialize (probably because of options expiration); however, our array of indicators say that a pullback is still a strong possibility for next week.
The DecisionPoint Weekly Wrap presents an end-of-week assessment of the trend and condition of the stock market (S&P 500), the U.S. Dollar, Gold, Crude Oil, and Bonds.
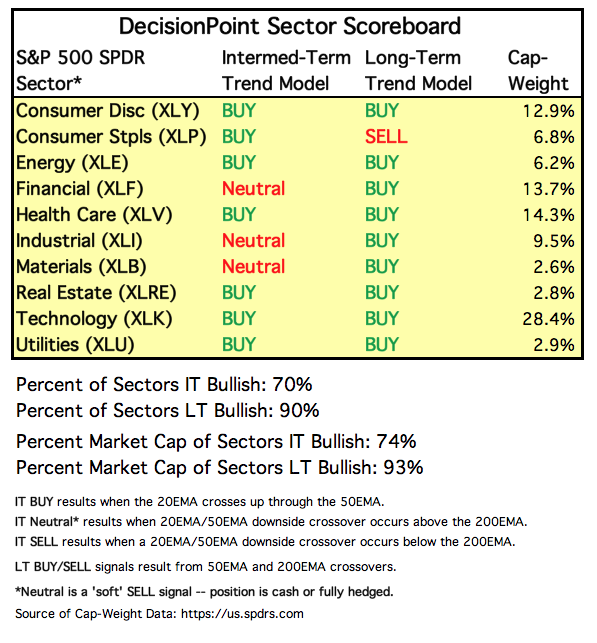
SECTORS
Each S&P 500 Index component stock is assigned to one, and only one, of 10 major sectors. This is a snapshot of the Intermediate-Term and Long-Term Trend Model signal status for those sectors.
STOCKS
IT Trend Model: BUY as of 5/11/2018
LT Trend Model: BUY as of 4/1/2016
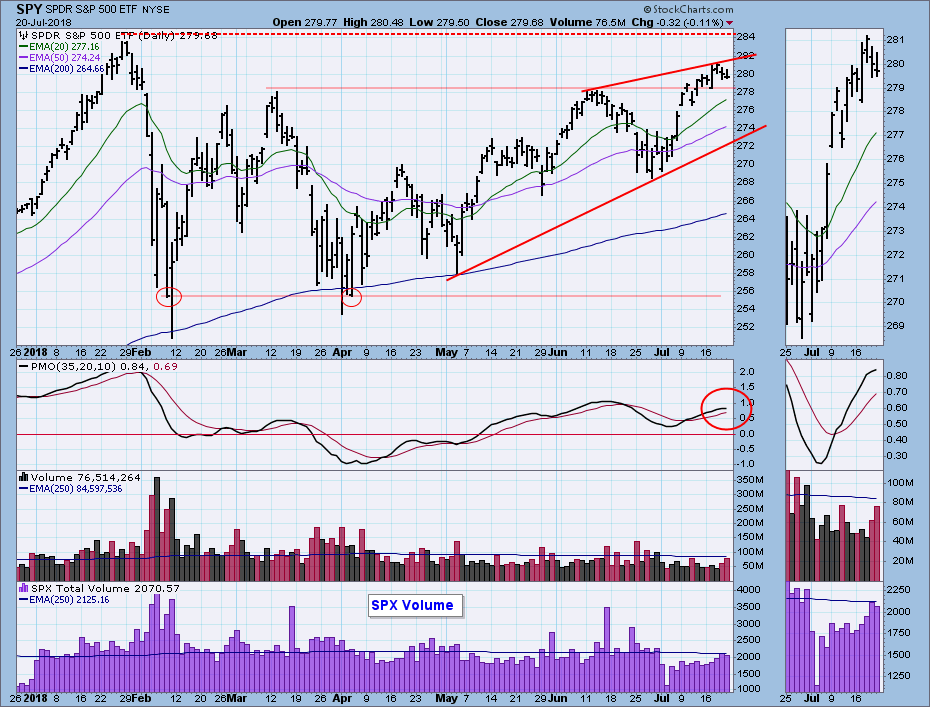
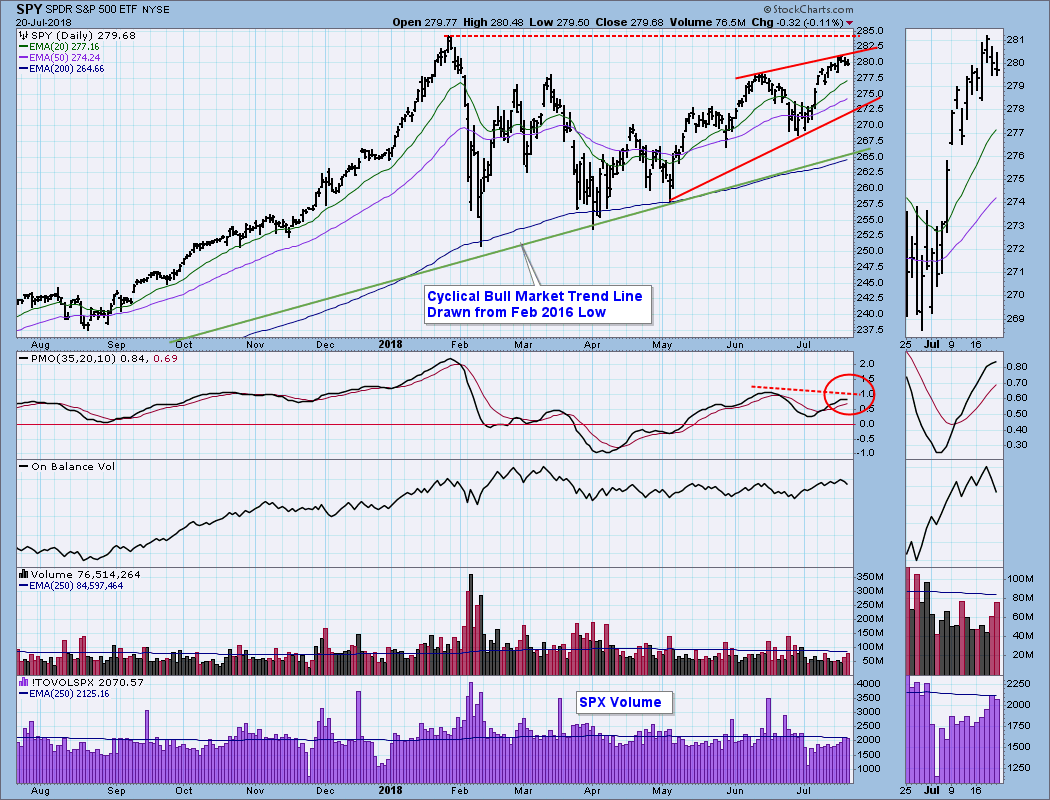
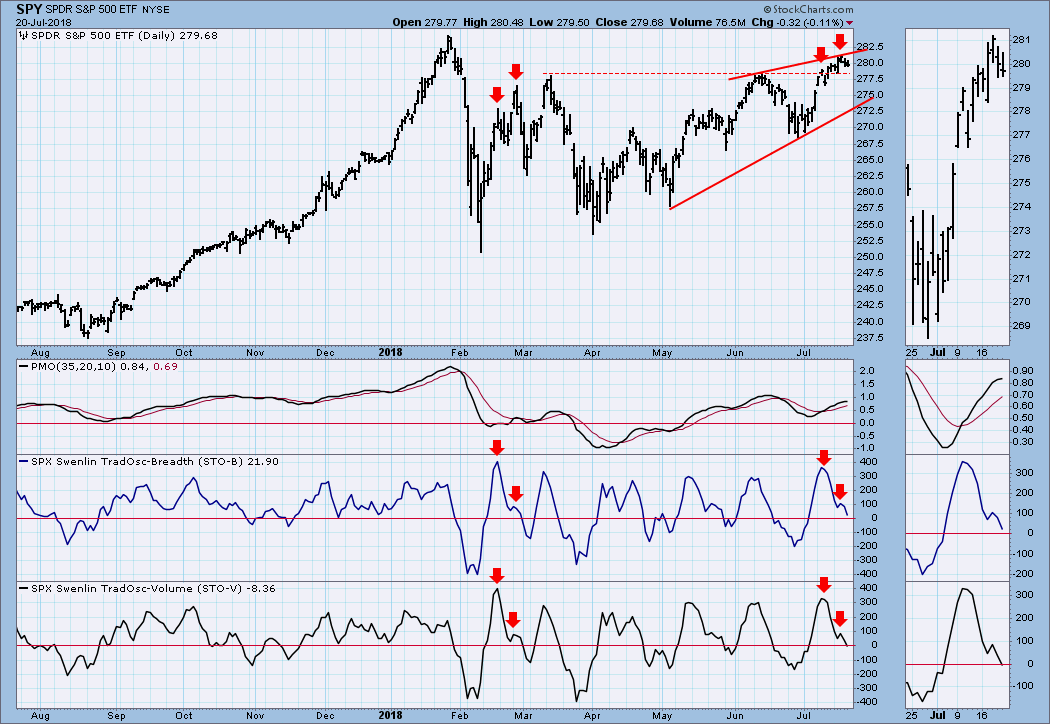
SPY Daily Chart: There is a daily PMO negative divergence. There is also a rising wedge, which we normally expect to resolve downward. Note that it will require plenty of downside before the bottom of the wedge is challenged, let alone penetrated.
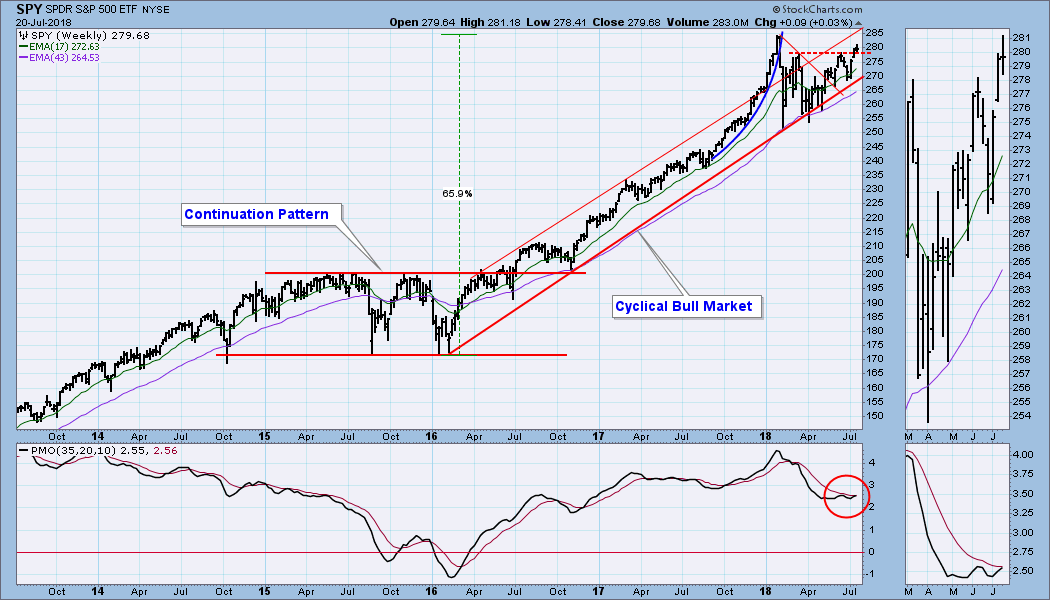
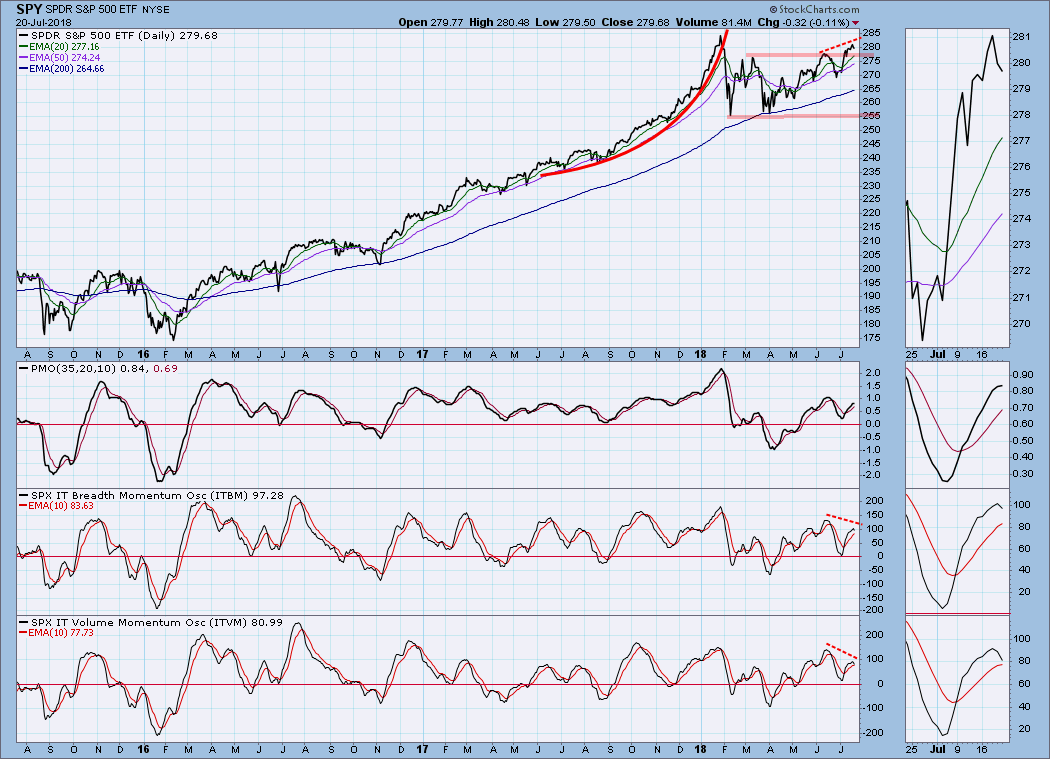
SPY Weekly Chart: Bullish. The weekly PMO has a double bottom and it is about to move up through the signal line. Price is about midway the rising trend channel.
Short-Term Market Indicators: This week the STO-B and STO-V formed tops that were lower than last week's tops. These are negative divergences against the higher price top. We can see a similar configuration back in February, and I think we will see a similar outcome next week.
Intermediate-Term Market Indicators: The ITBM and ITVM have topped, forming negative divergences. If the PMO tops it will be unanimous.
Conclusion: There is a rising wedge formation on the SPY chart, and our short-term and intermediate-term indicators have topped and formed negative divergences. This constitutes a a ton of evidence that a market correction is probably coming next week.
DOLLAR (UUP)
IT Trend Model: BUY as of 4/24/2018
LT Trend Model: BUY as of 5/25/2018
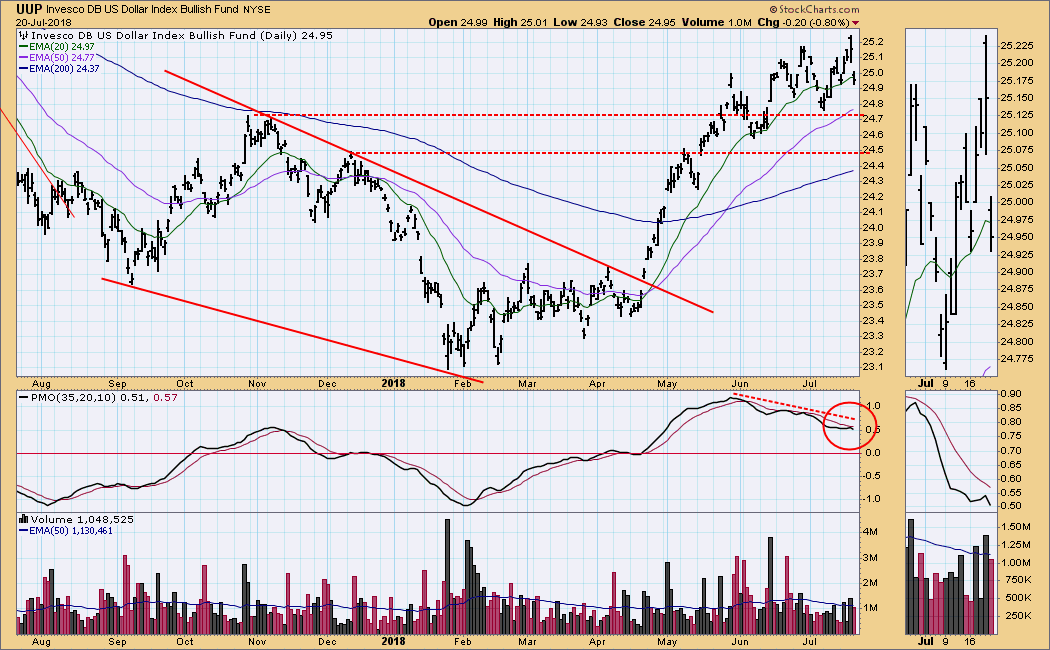
UUP Daily Chart: Last week I said that it looked as if UUP was topping, so this week UUP made a new high. Nevertheless, there is a PMO negative divergence, and the PMO is below the signal line and falling. I still think UUP has a correction coming.
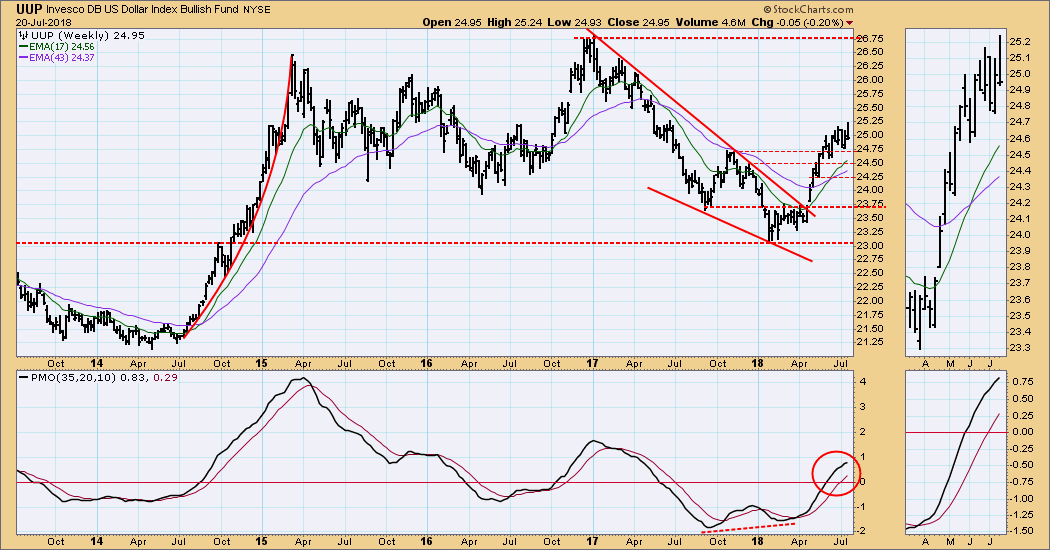
UUP Weekly Chart: Not really any problems here except the price congestion of the last several weeks, which could be preparation for a top.
GOLD
IT Trend Model: NEUTRAL as of 5/2/2018
LT Trend Model: SELL as of 6/22/2018
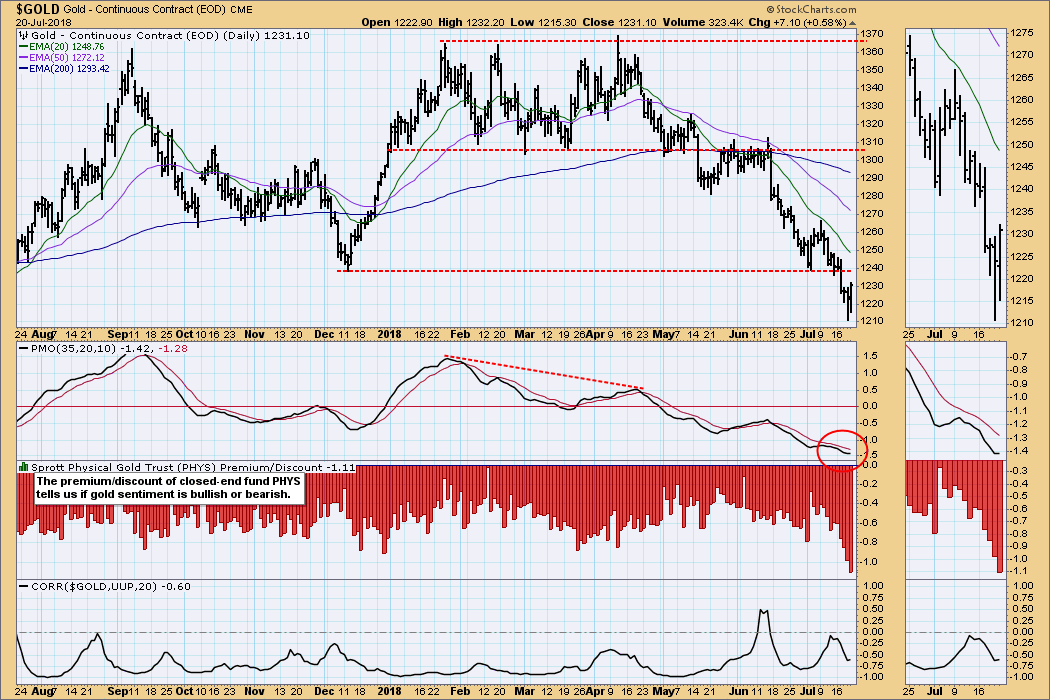
GOLD Daily Chart: Last week the daily PMO had topped below the signal line, and price was testing horizontal support, making this week's breakdown seem inevitable. Also, the PHYS discount was the largest since 2013 -- not really washout sentiment, but could be of short-term significance.
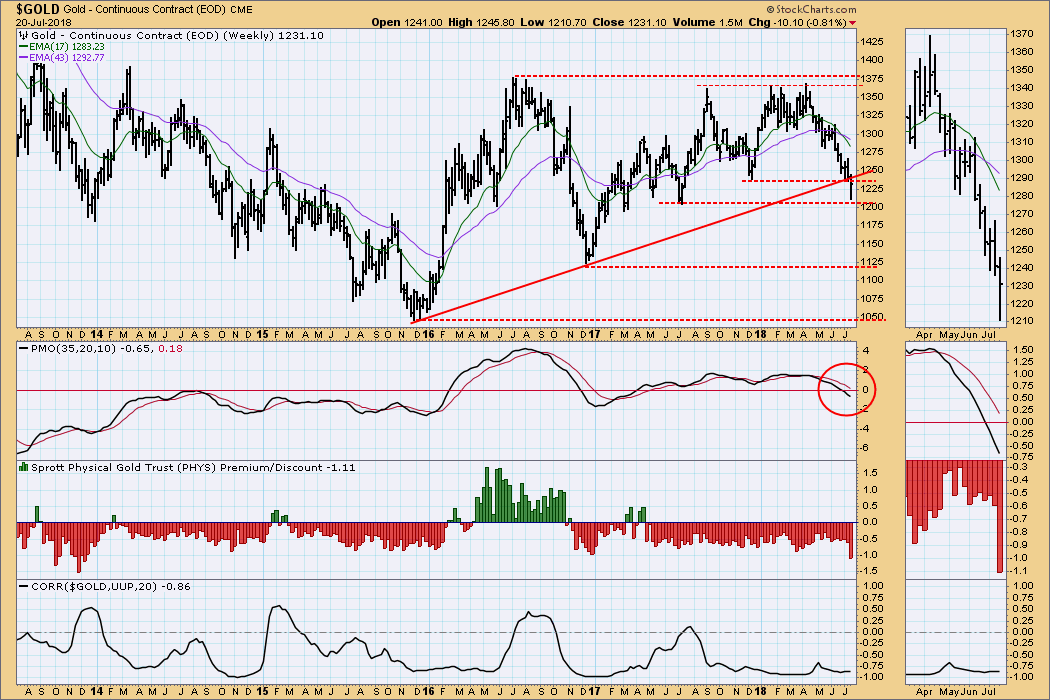
GOLD Weekly Chart: Important support was broken this week, but gold managed to bounce off horizontal support and recover almost back to the point of breakdown.
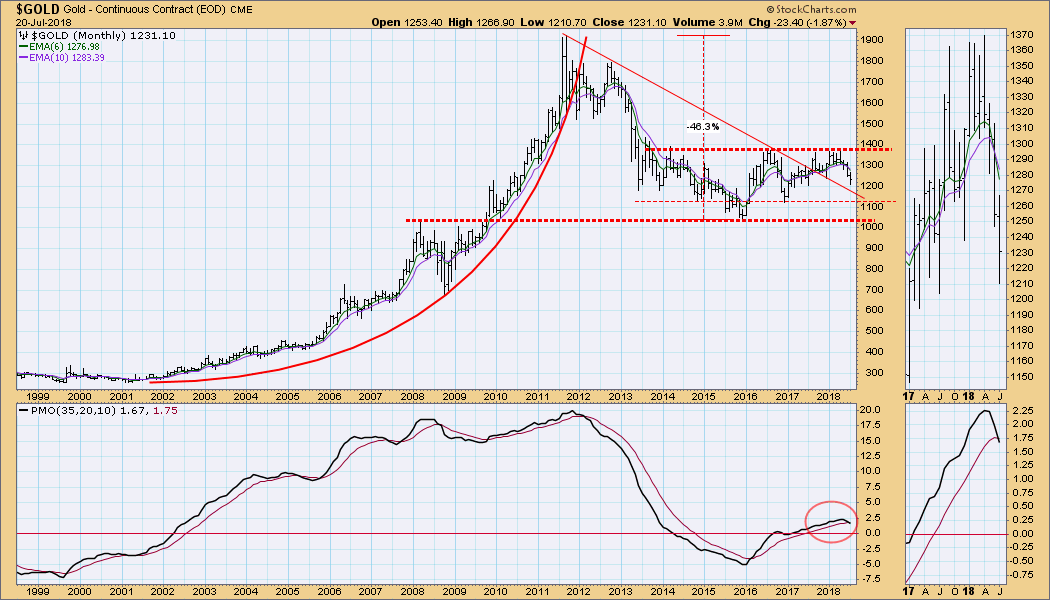
GOLD Monthly Chart: I don't normally post a monthly chart mid-month, but I wanted to get a look at this week's pullback in the longest context. We can see that gold is approaching the declining tops line drawn from the all-time high in 2011, but at this point I think that the trading range from about 1020 and 1380 is more relevant. There is also support around 1120 that could come into play first.
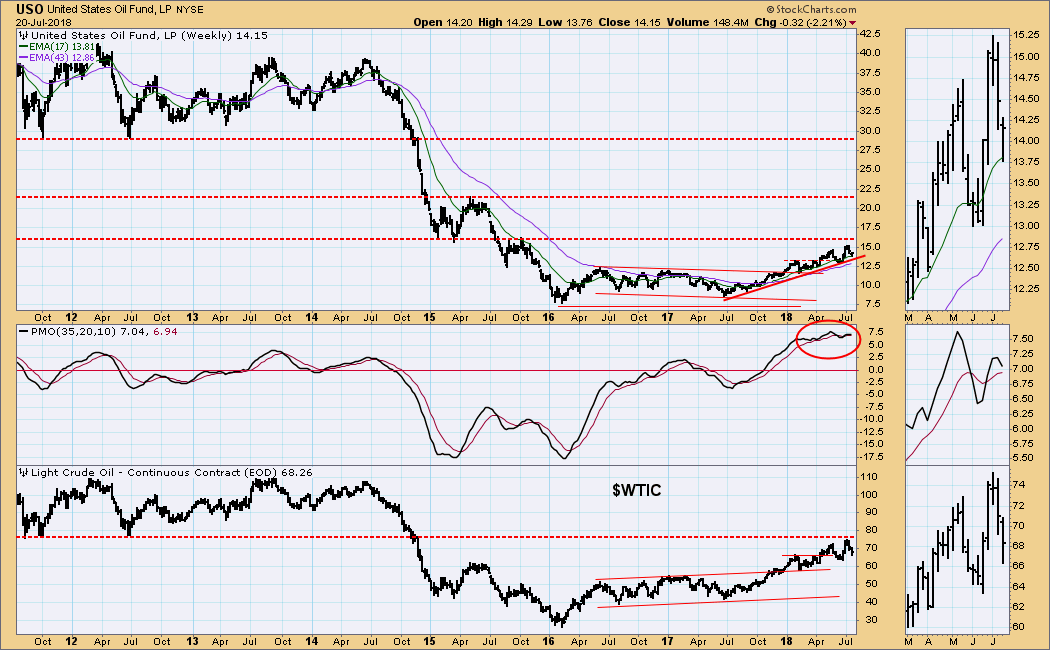
CRUDE OIL (USO)
IT Trend Model: BUY as of 6/26/2018
LT Trend Model: BUY as of 11/2/2017
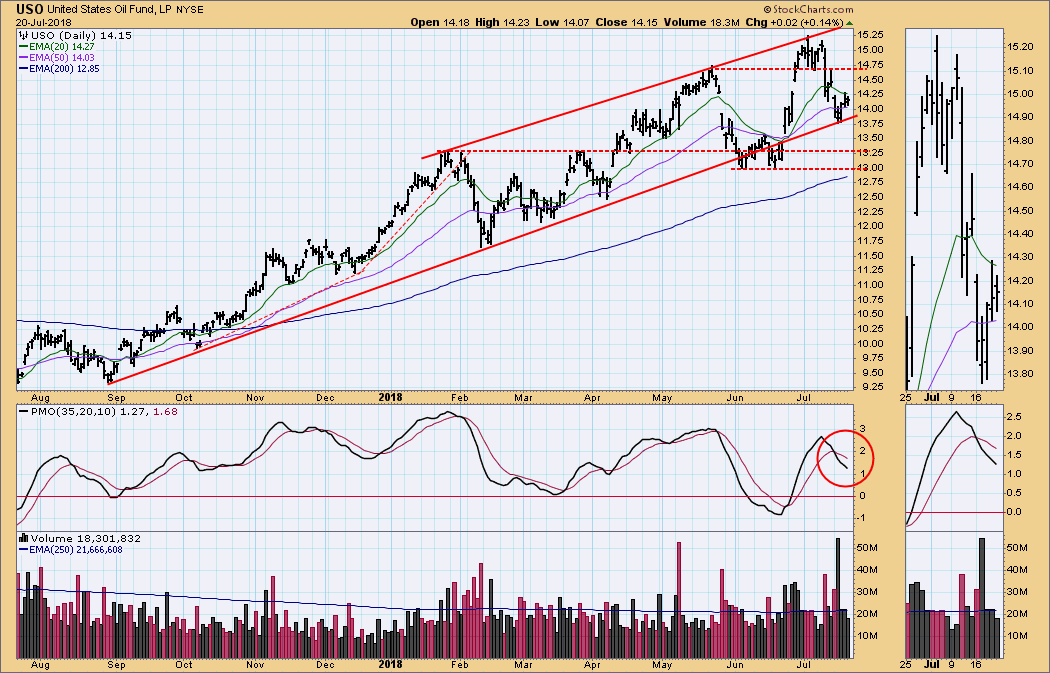
USO Daily Chart: Price has pulled back to the bottom of the rising trend channel, but I don't like that rising trend line because of the violations that occurred in June. I think that the two horizontal support lines just below are better targets.
USO Weekly Chart: We can see on the weekly chart that both $WTIC and USO have approached and are moving down from long-term overhead resistance, which is at about $76.00 for crude. The weekly PMO has topped again. The resistance lines fall at different levels in the price structure on both charts because USO reflects the slippage inherent in constantly rolling over futures contracts.
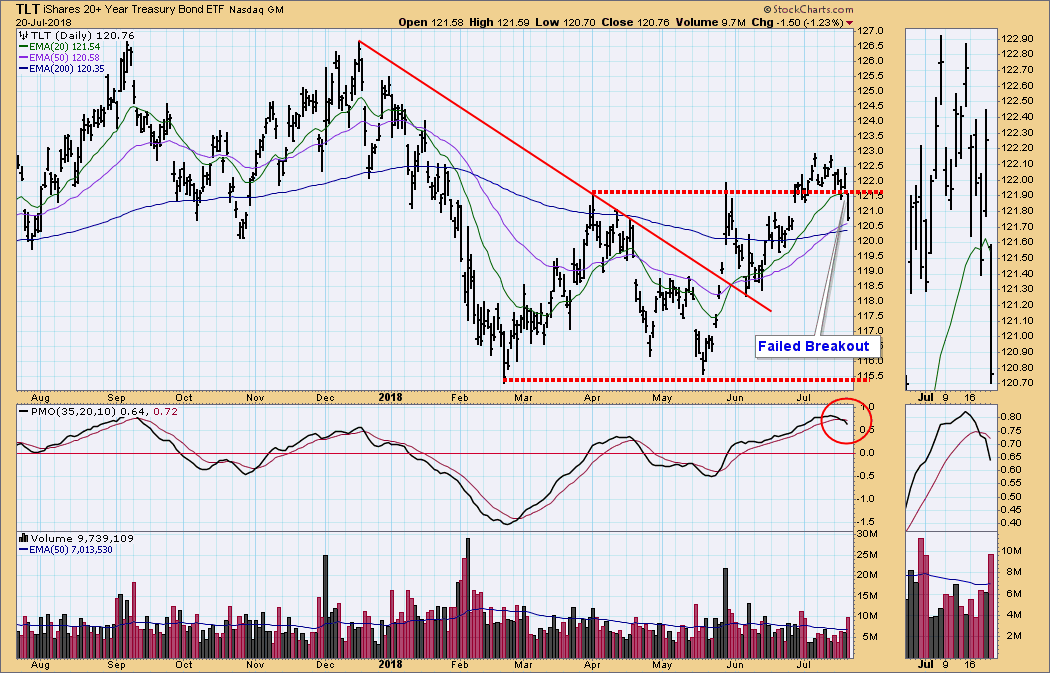
BONDS (TLT)
IT Trend Model: BUY as of 6/1/2018
LT Trend Model: BUY as of 7/13/2018
TLT Daily Chart: Last week the LT Trend Model changed to a BUY signal, and my comment was: ". . . there is every indication that price is headed higher." Well, this week price moved lower instead, breaking down through the support that was the double bottom confirmation line. The daily PMO has crossed down through the signal line, and I think we should assume that a trading range is in effect.
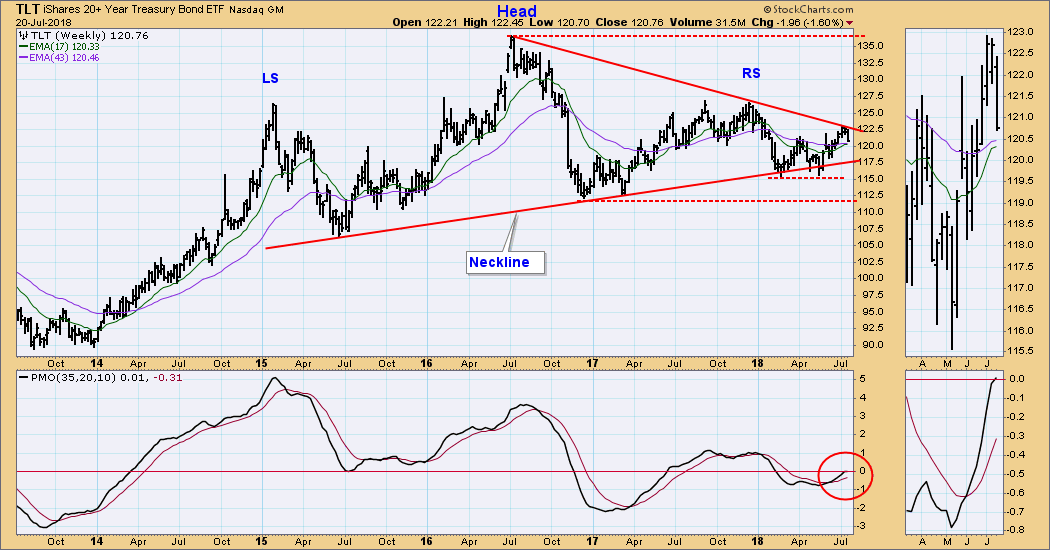
TLT Weekly Chart: Last week the head and shoulders pattern seemed to be on the verge of extinction, but after this week's breakdown, it still dominates this time frame. The weekly PMO is decelerating and should top if the decline persists.
**Don't miss any of the DecisionPoint commentaries! Go to the "Notify Me" box toward the end of this blog page to be notified as soon as they are published.**
Technical Analysis is a windsock, not a crystal ball.
Happy Charting!
- Carl
NOTE: The signal status reported herein is based upon mechanical trading model signals, specifically, the DecisionPoint Trend Model. They define the implied bias of the price index based upon moving average relationships, but they do not necessarily call for a specific action. They are information flags that should prompt chart review. Further, they do not call for continuous buying or selling during the life of the signal. For example, a BUY signal will probably (but not necessarily) return the best results if action is taken soon after the signal is generated. Additional opportunities for buying may be found as price zigzags higher, but the trader must look for optimum entry points. Conversely, exit points to preserve gains (or minimize losses) may be evident before the model mechanically closes the signal.
Helpful DecisionPoint Links:
DecisionPoint Shared ChartList and DecisionPoint Chart Gallery
Price Momentum Oscillator (PMO)
Swenlin Trading Oscillators (STO-B and STO-V)