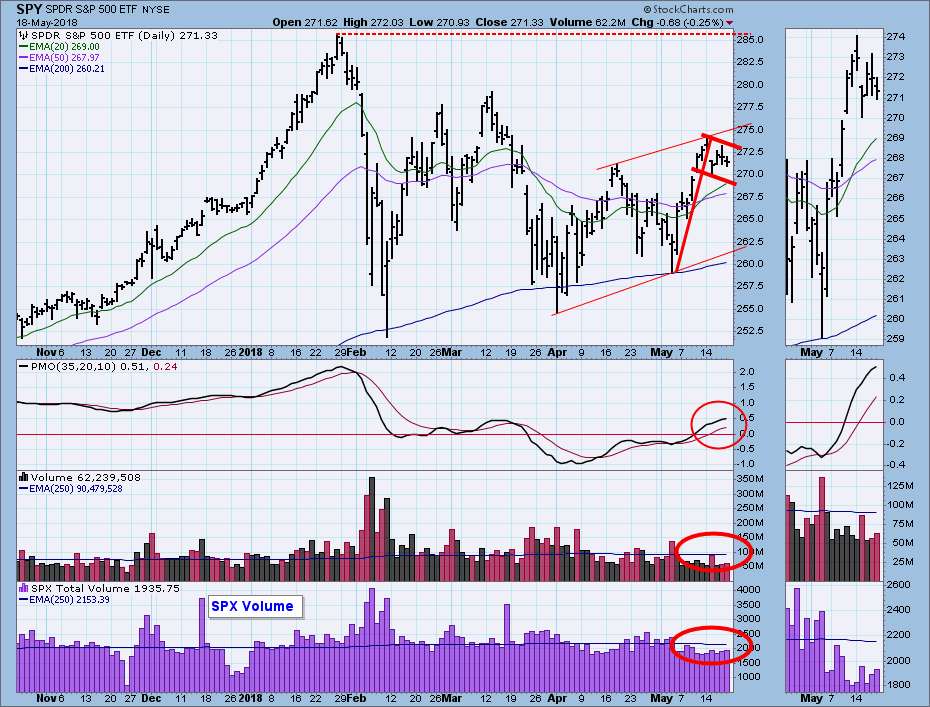
Back in the day, options expiration days were characterized by high volatility and exceptionally high volume; however, in recent years the market stays relatively calm, and the high volume only appears at the end of each quarter. These expectations were not disappointed in today's trading. In fact, the entire week was calm, as price worked sideways into a flag formation. Volume for the last two weeks has been somewhat thin, which implies that market participants are not fully committed to the rally. Nevertheless, from the April low a rising trend has been established (a bottom above a bottom, and a top above a top), and the picture remains positive.
The DecisionPoint Weekly Wrap presents an end-of-week assessment of the trend and condition of the stock market (S&P 500), the U.S. Dollar, Gold, Crude Oil, and Bonds.
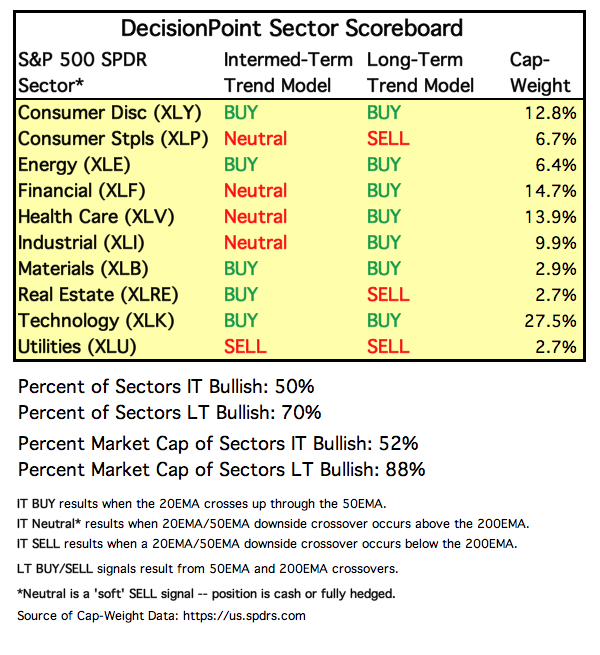
SECTORS
Each S&P 500 Index component stock is assigned to one, and only one, of 10 major sectors. This is a snapshot of the Intermediate-Term and Long-Term Trend Model signal status for those sectors.
STOCKS
IT Trend Model: BUY as of 5/11/2018
LT Trend Model: BUY as of 4/1/2016
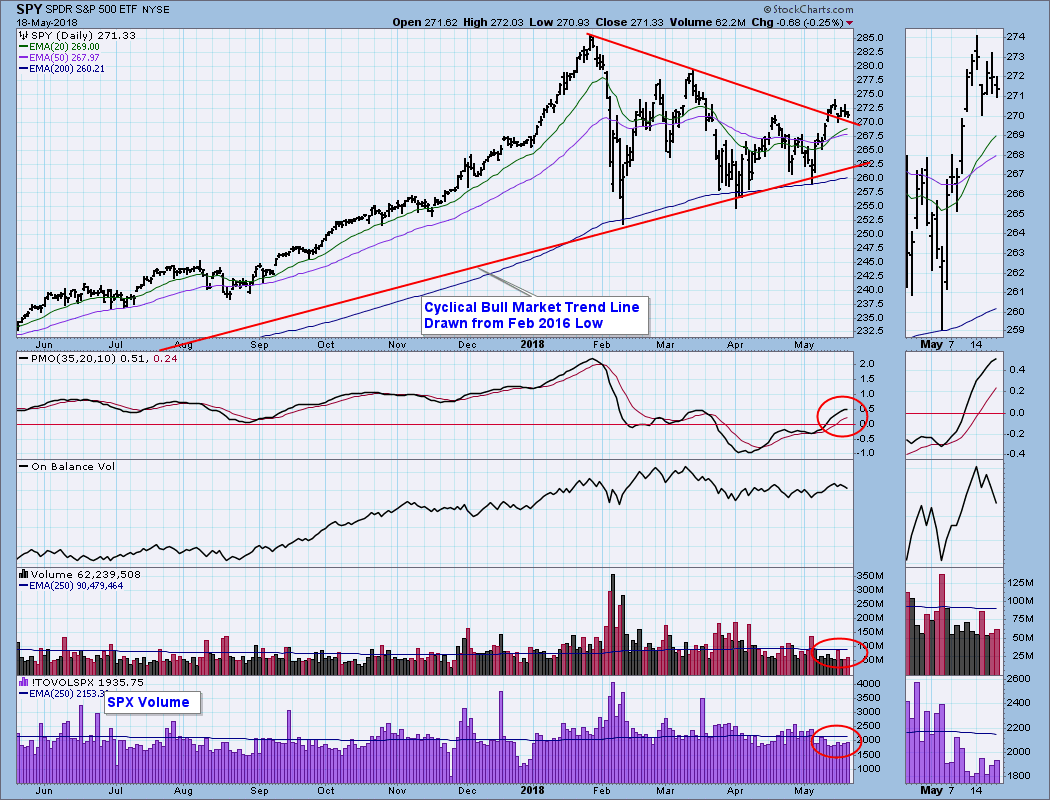
SPY Daily Chart: Another perspective shown on this daily chart is SPY's relationship to the cyclical bull market rising trend line. Also, we can see how SPY has broken out of a symmetrical triangle and is consolidating just above it. If it breaks down from that support, that would be a problem.
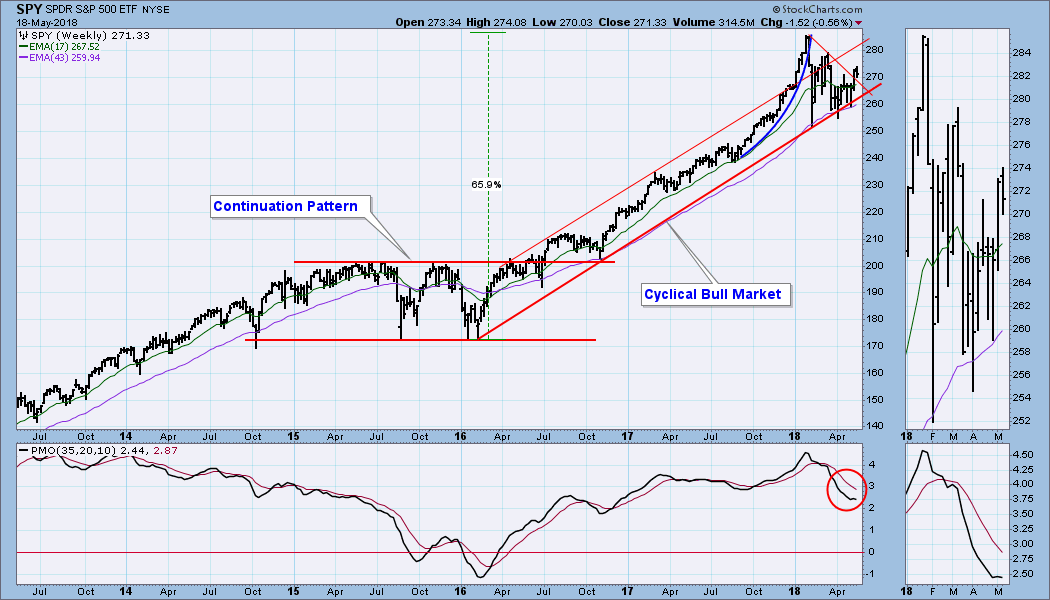
SPY Weekly Chart: SPY is in the middle of the bull market rising trend channel. The weekly PMO is indecisive, having turned up last week, now turning back down this week.
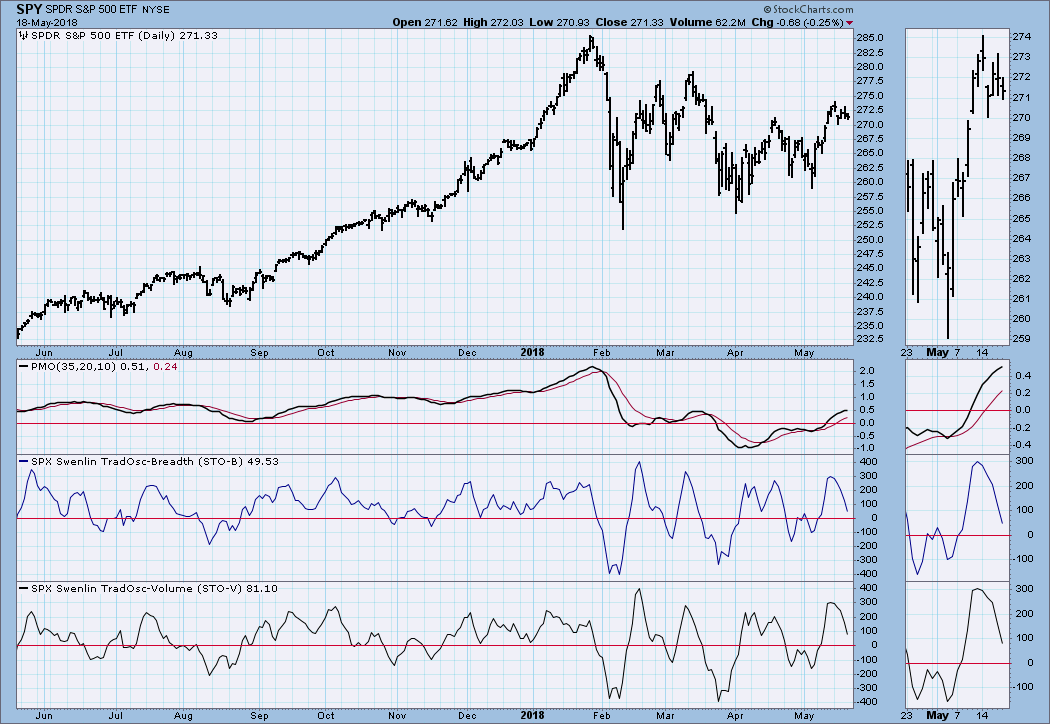
Short-Term Market Indicators: So far the market is behaving bullishly in this time frame. Specifically, the indicators are moving down from overbought readings, while price is holding its ground.
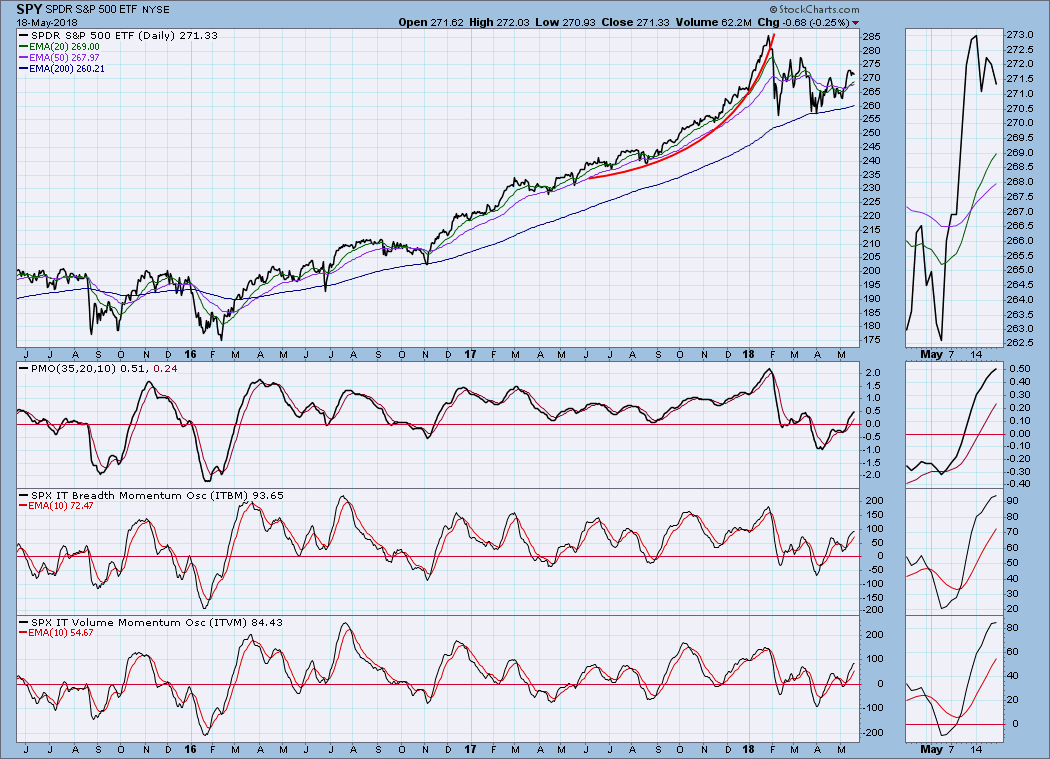
Intermediate-Term Market Indicators: If price continues to consolidate, these indicators will top, which would be a concern. But they are still far from being overbought, and will accommodate higher prices if the rally continues.
Conclusion: Last week I gave up on the idea that we are in a bear market, and I didn't see anything this week to make me regret that decision. I am particularly encouraged by the fact that short-term overbought conditions are being relieved without significant price deterioration. So far, so good. In spite of conditions having edged toward the positive, I can't say that I'm especially excited about the market's prospects one way or the other. I suppose that is because for almost four months the market has been moving sideways in a range that has become gradually more narrow. And, while the models are on BUY, I still feel mostly NEUTRAL.
DOLLAR (UUP)
IT Trend Model: BUY as of 4/24/2018
LT Trend Model: SELL as of 5/24/2017
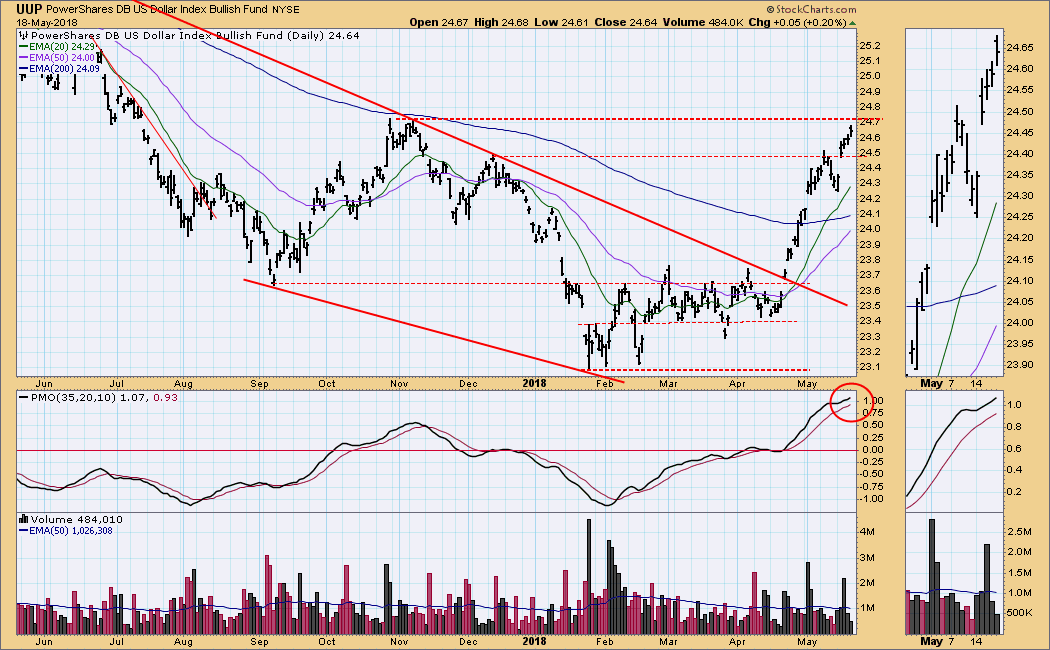
UUP Daily Chart: Last week UUP consolidated the up gap from the previous week, and this week UUP gapped up again. At this point price is approaching overhead resistance, and the PMO is overbought and near the top of an eight-year range.
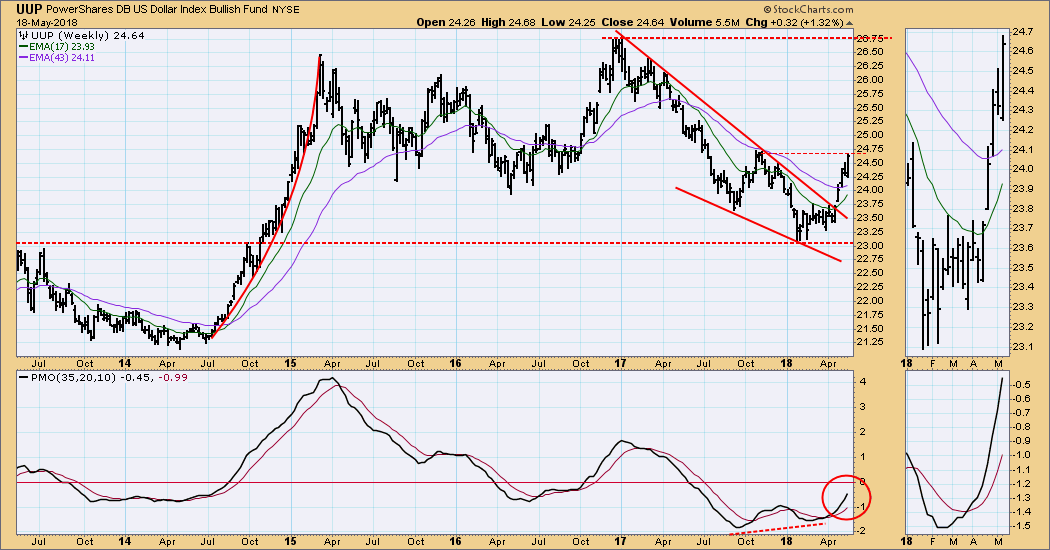
UUP Weekly Chart: We can see a strong breakout from a large falling wedge, and I think this up move will last a while.
GOLD
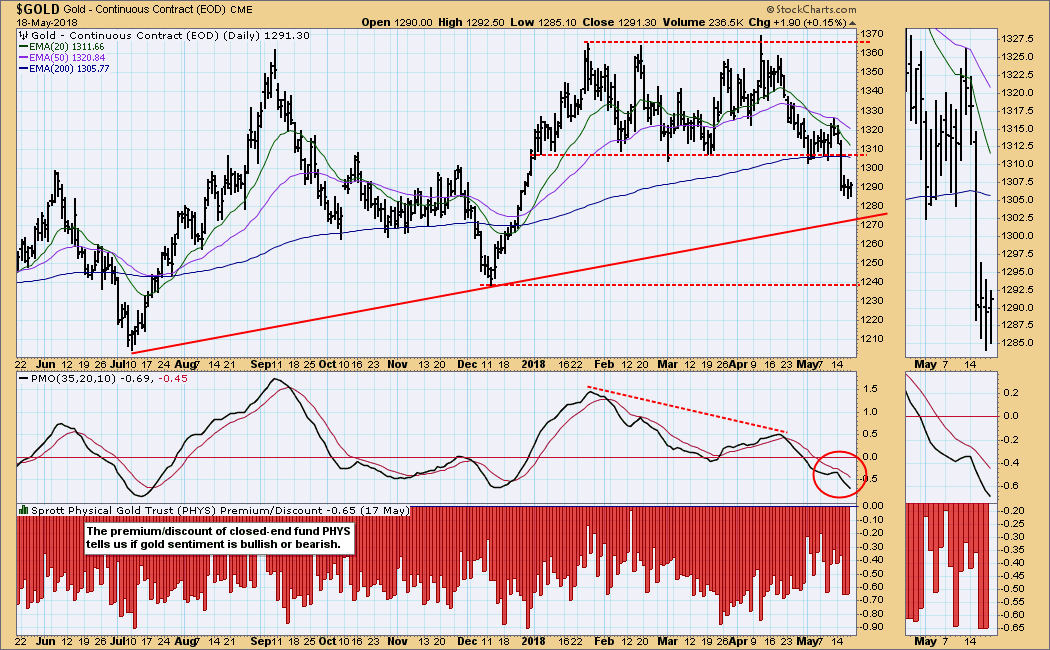
IT Trend Model: NEUTRAL as of 5/2/2018
LT Trend Model: BUY as of 4/12/2017
GOLD Daily Chart: Strength in the dollar translated directly into weakness in gold, which broke down through the bottom of the trading range it has maintained all this year.
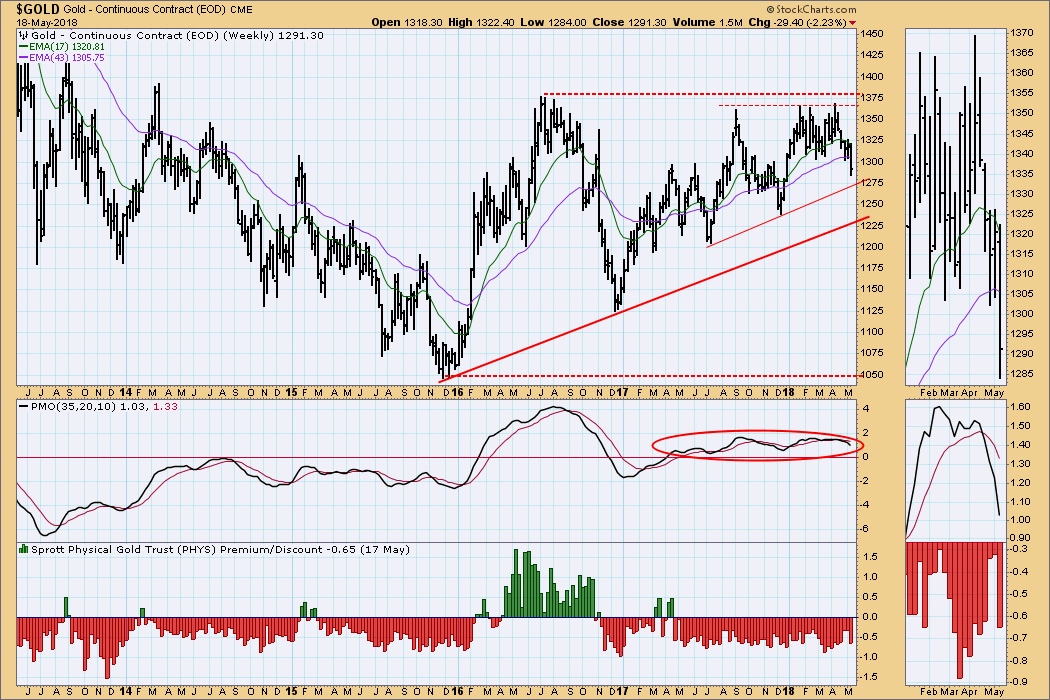
GOLD Weekly Chart: In the last year gold has made numerous attempts to reach line of resistance drawn across the 2016 high, but each attempt failed. Now gold appears to be headed toward a test of one-year rising trend line. Overall gold is modestly positive -- the 17EMA is above the 43EMA, and the PMO is in positive territory -- but the trends are not encouraging.
CRUDE OIL (USO)
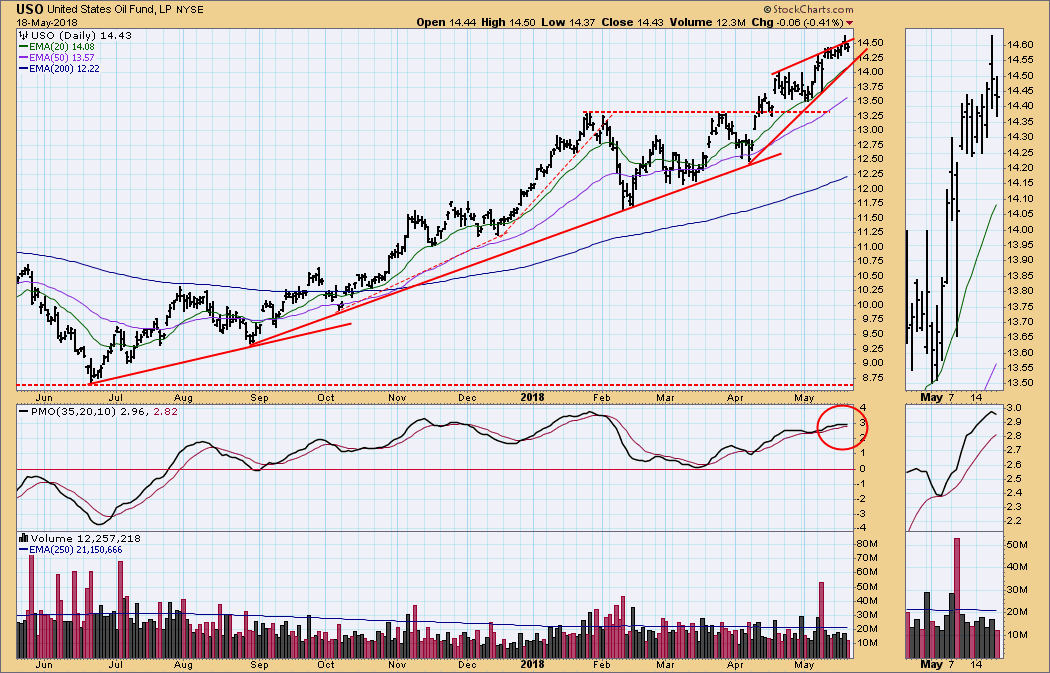
IT Trend Model: BUY as of 9/6/2017
LT Trend Model: BUY as of 11/2/2017
USO Daily Chart: For nearly two weeks USO has been hugging the top of a rising wedge pattern, which gives the impression that the pattern will resolve upward, the opposite of what we normally expect. On the other hand, the daily PMO has topped, so another test of the rising trend line could be in the cards. I continue to note the series of rising trend lines, each steeper than the preceding one, which resembles a parabolic advance. A modest correction would be healthy, but I don't expect anything major to the downside.
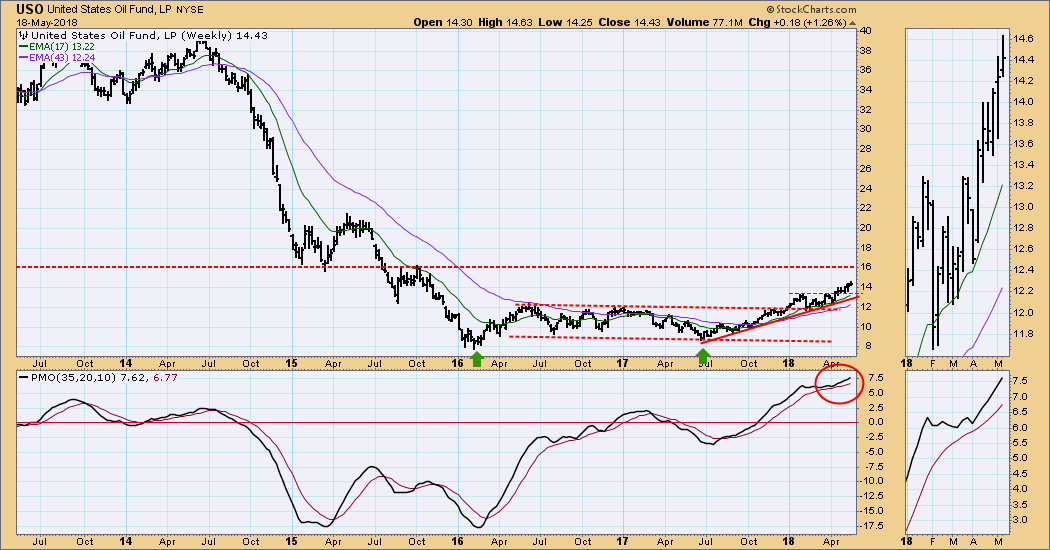
USO Weekly Chart: Again, I see resistance at about 16.00, which would be about $78/bbl for crude.
BONDS (TLT)
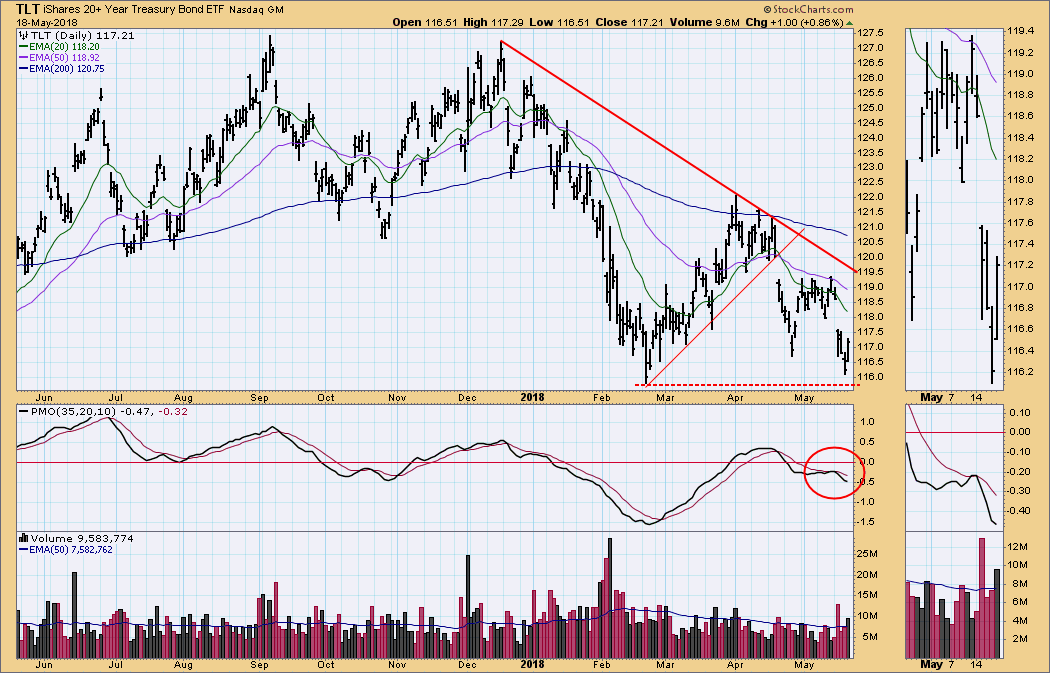
IT Trend Model: SELL as of 4/20/2018
LT Trend Model: SELL as of 2/8/2018
TLT Daily Chart: The rally off the April low became a two-week sideways consolidation in May, but this week TLT broke down sharply. The daily PMO topped below the signal line as well as the zero line, a very negative configuration. The overwhelming negative for the bond market is that the 35-year bull market in bonds is over, and it is a virtual certainty that the long-term direction in bond prices will be down. A part of that down trend will be occasional counter-trend rallies, like the one from the February low, but it is unlikely that we will see new all-time highs for decades.
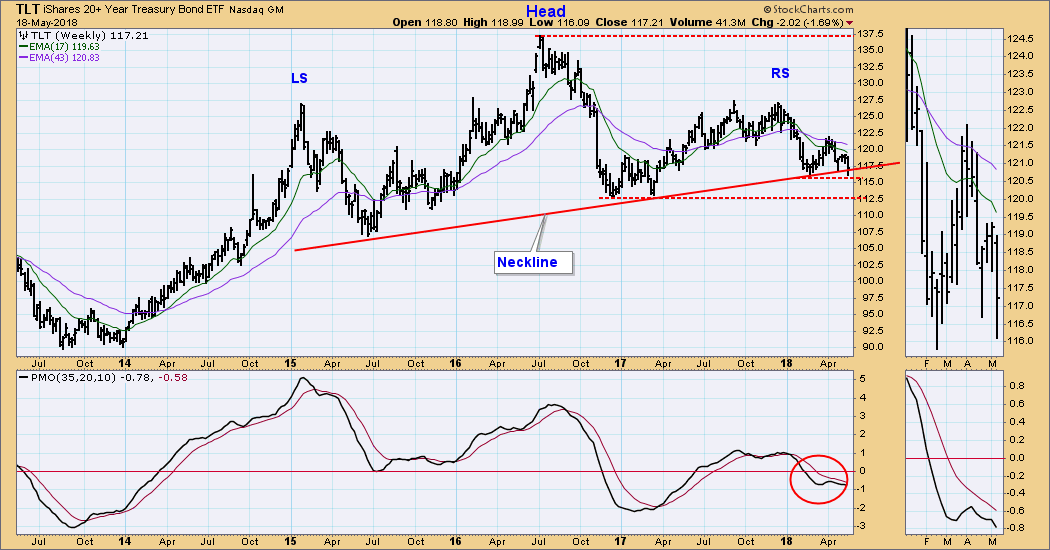
TLT Weekly Chart: The large head and shoulders formation is close to executing, meaning that price is trying to break below the neckline. I fully expect that to happen.
**Don't miss any of the DecisionPoint commentaries! Go to the "Notify Me" box toward the end of this blog page to be notified as soon as they are published.**
Technical Analysis is a windsock, not a crystal ball.
Happy Charting!
- Carl
NOTE: The signal status reported herein is based upon mechanical trading model signals, specifically, the DecisionPoint Trend Model. They define the implied bias of the price index based upon moving average relationships, but they do not necessarily call for a specific action. They are information flags that should prompt chart review. Further, they do not call for continuous buying or selling during the life of the signal. For example, a BUY signal will probably (but not necessarily) return the best results if action is taken soon after the signal is generated. Additional opportunities for buying may be found as price zigzags higher, but the trader must look for optimum entry points. Conversely, exit points to preserve gains (or minimize losses) may be evident before the model mechanically closes the signal.
Helpful DecisionPoint Links:
DecisionPoint Shared ChartList and DecisionPoint Chart Gallery
Price Momentum Oscillator (PMO)
Swenlin Trading Oscillators (STO-B and STO-V)