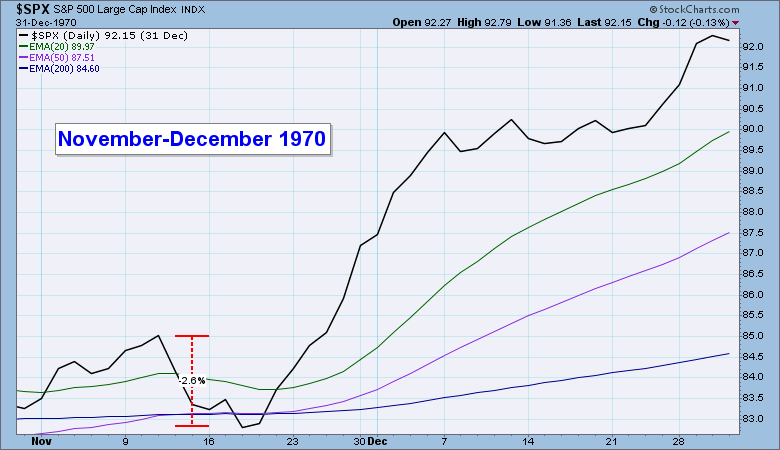
I awoke Monday morning to news of the outrage that had taken place in Las Vegas the night before, and I experienced the now all-to-familiar feelings of weariness at the state of the world. There has been enough rehash of this terrible event, and my purpose of mentioning it was not further intrude on your peace of mind. There is a lesson to be learned here about how the market reacts to catastrophic events. Many of the financial commentators were truly amazed that the market didn't seem to be fazed by the horror that had transpired. In fact, the market rallied every day except Friday. The reason is simple: The market is a sociopath and has no empathy whatsoever regarding anything that does not directly affect it. An extreme example of this is the Bhola Cyclone that struck East Pakistan on November 12, 1970, eventually causing the death of about 500,000 people. It doesn't get much more horrific than that, but the chart below shows that the S&P 500 lost only -2.6% in a week, then it rallied into the year's end. Obviously, markets in Pakistan would have reacted negatively.
 I could go much more deeply into this subject, but my purpose is just to get you thinking about the kinds of news events that are important to the market, and those that are not. How we personally feel about news is irrelevant, because the market probably has an entirely different point of view.
The DecisionPoint Weekly Wrap presents an end-of-week assessment of the trend and condition of the stock market (S&P 500), the U.S. Dollar, Gold, Crude Oil, and Bonds.
STOCKS
IT Trend Model: BUY as of 11/15/2016
LT Trend Model: BUY as of 4/1/2016
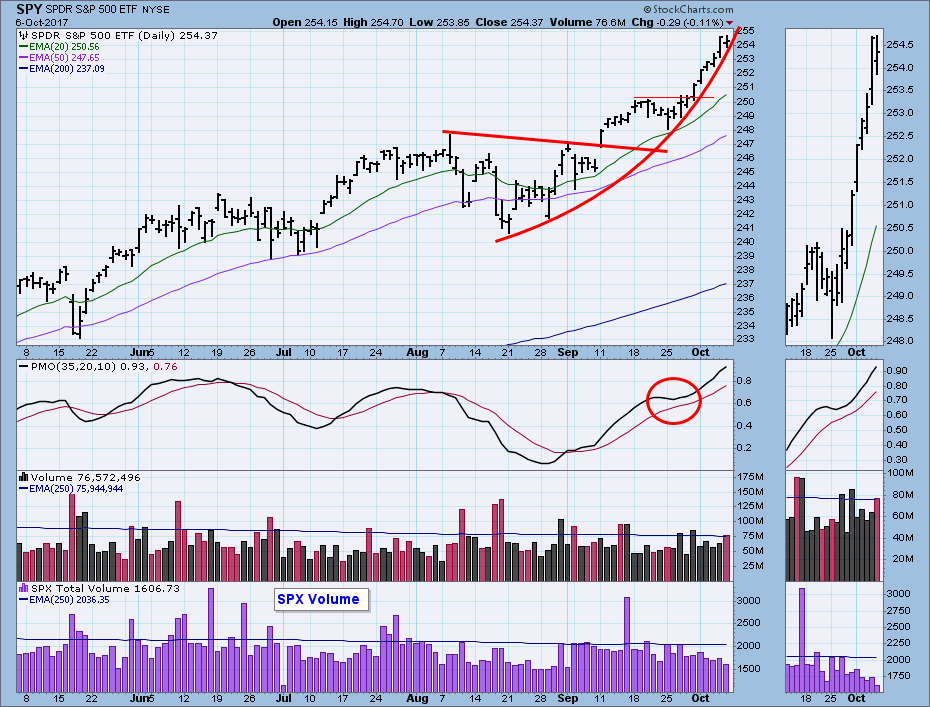
Daily Chart: We can see a bit of a parabolic advance here, but it is a short-term pattern with short-term implications. Volume on this week's rally was below average, but not alarmingly so. The daily PMO topped in the middle of September, so I was looking for a pullback. But not so fast! The rally resumed and the PMO turned up again.
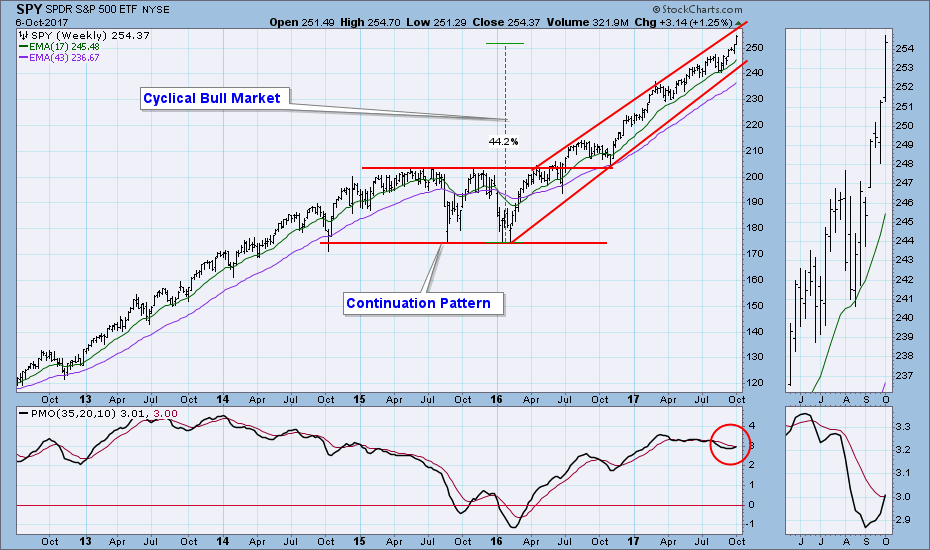
Weekly Chart: SPY is getting close to the top of the rising trend channel. That doesn't mean it will stopped there, but it probably will. The weekly PMO is overbought, but it is rising and has crossed above its signal line.
Short-Term Market Indicators: These indicators have topped in overbought territory, so, again, we should be alert for a pause or pullback.
Intermediate-Term Market Indicators: These indicators are more overbought than they were last week. Still waiting for them to top.
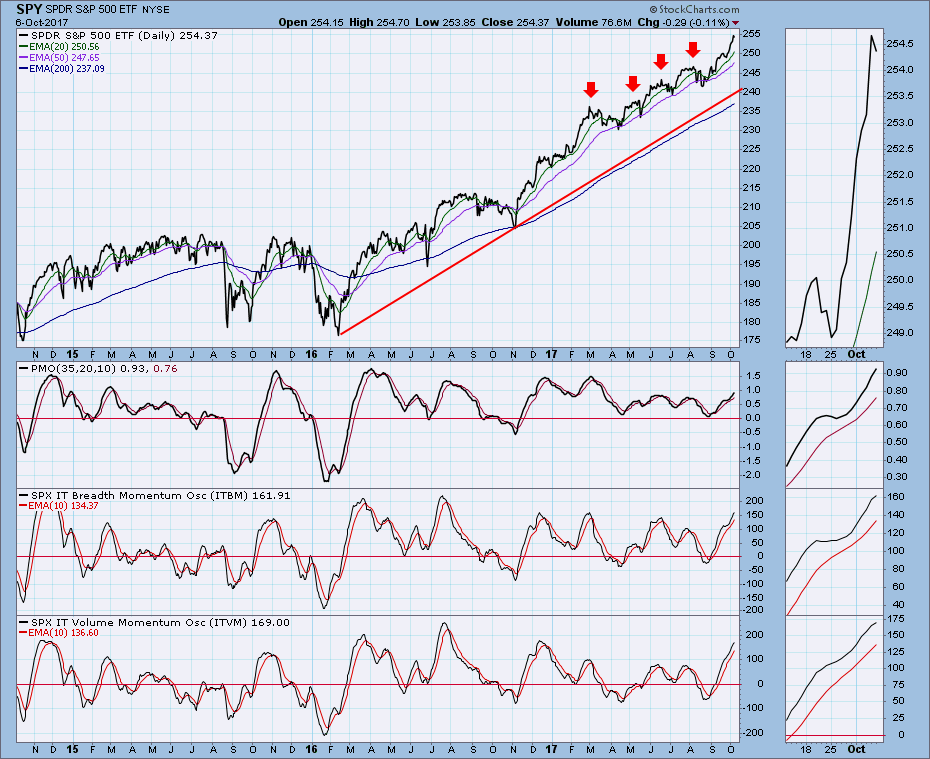
Conclusion: Looking at the chart just above, we can see that price is really stretched far above the bull market rising trend line. Both short- and intermediate-term indicators are overbought, so conditions are doubly favorable for a pullback. But we are also in a bull market, and things can get even more overbought. The parabolic condition I noted on the daily chart, indicates that a correction could be a bit more dramatic than we have seen lately, but I still don't expect much of a correction, because the market just doesn't seem to want to give back any of its gains. I wouldn't be surprised if the price advance becomes even more vertical before it gives up for a while.
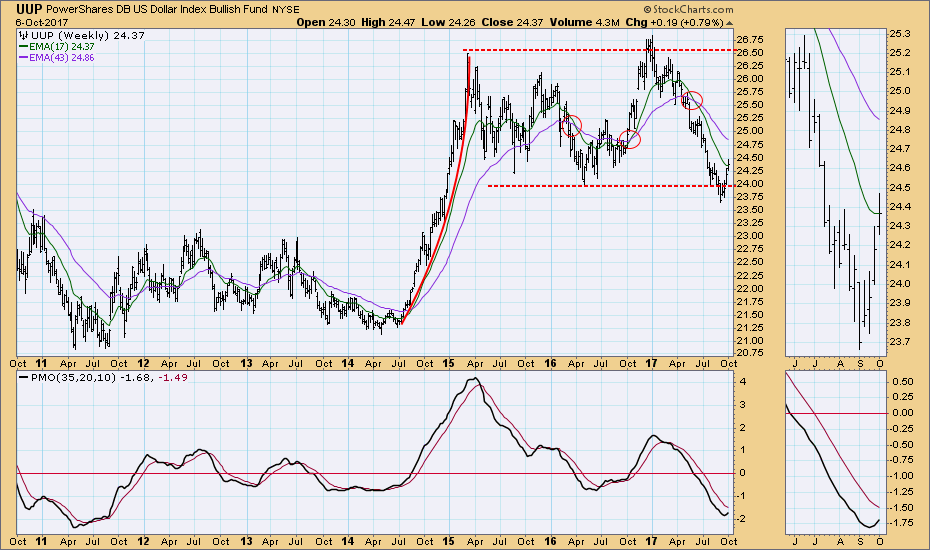
DOLLAR (UUP)
IT Trend Model: NEUTRAL as of 3/21/2017
LT Trend Model: SELL as of 5/24/2017
UUP has rallied for two weeks, and the PMO has plenty of room before it gets overbought.
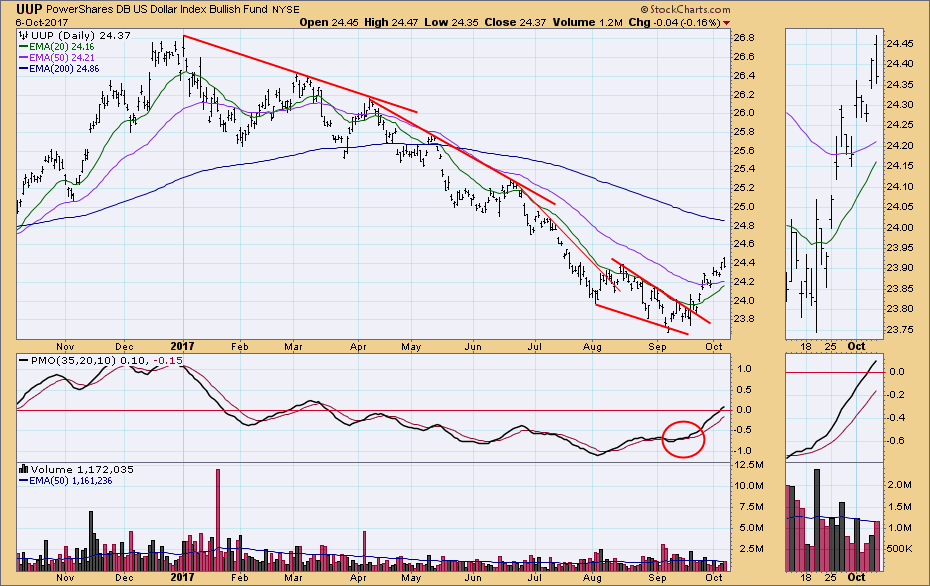
The weekly PMO has formed a nice bottom, and it supports the idea of a continued rally.
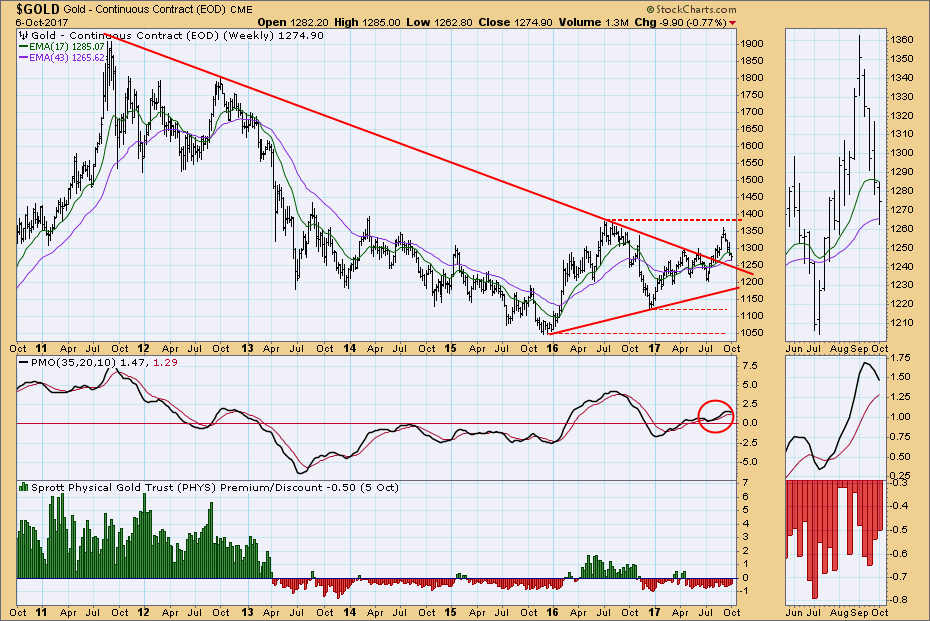
GOLD
IT Trend Model: BUY as of 7/31/2017 (Could change to NEUTRAL next week.)
LT Trend Model: BUY as of 4/12/2017
On the daily chart gold has an upward bias from the 2016 price low, but in the last month it has lost a lot of ground. If the decline continues, the 20EMA will soon cross down through the 50EMA, making the picture even more negative. Sentiment is still solidly bearish, which works against any rally.
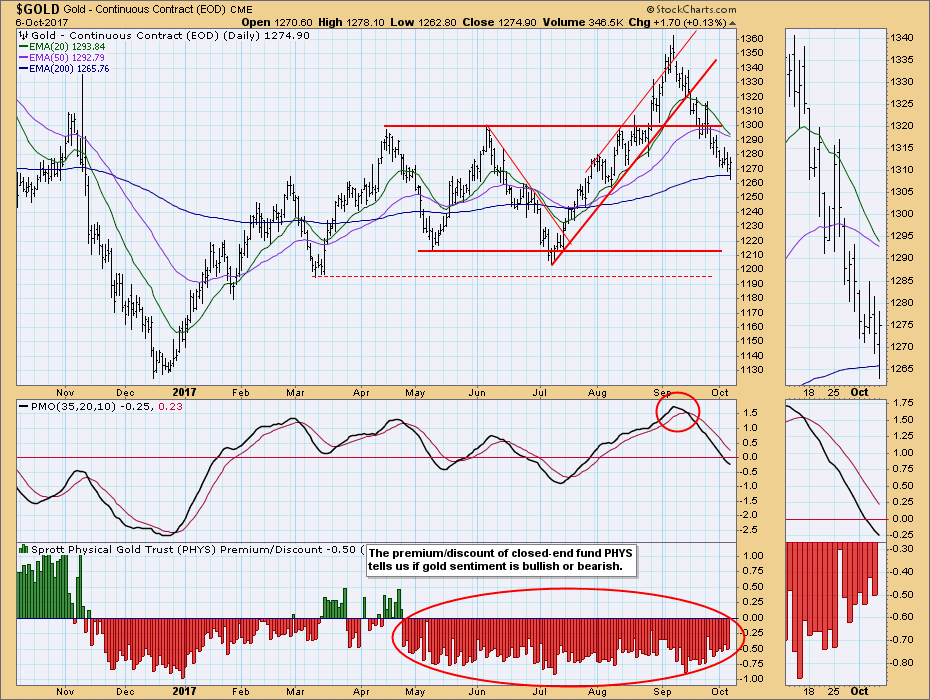
Gold is still above the long-term declining tops line, but the weekly PMO has topped, making continued decline more likely.
CRUDE OIL (USO)
IT Trend Model: BUY as of 9/6/2017
LT Trend Model: SELL as of 3/9/2017
While USO broke above the declining tops line drawn from the January top, it is now correcting back to that line. Note that the rising bottoms line drawn from the June low has intersected the declining tops line, and may provide stronger support for falling price.
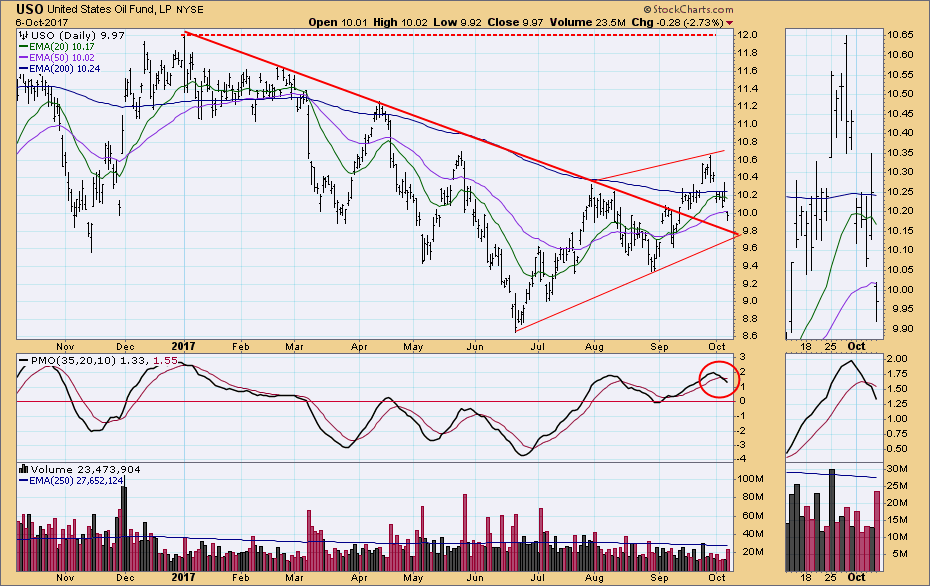
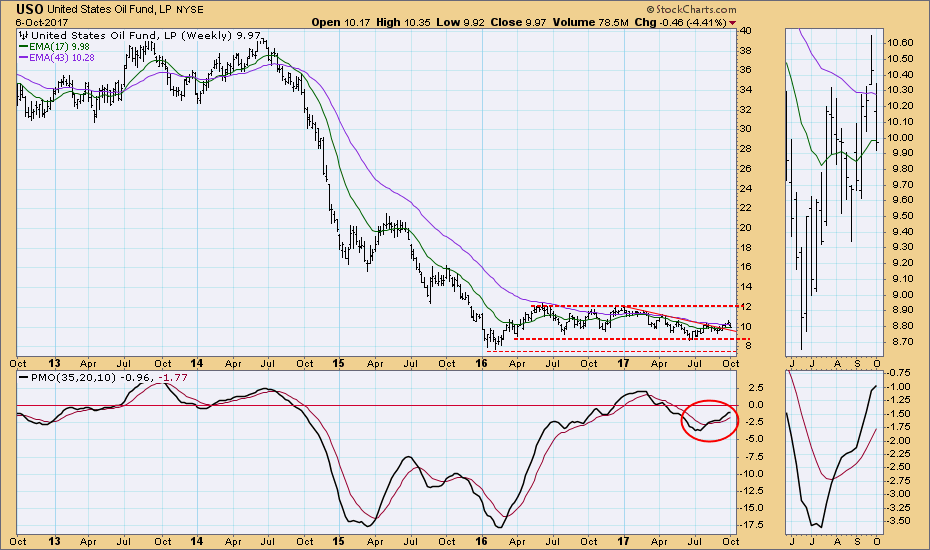
The 18-month trading range shows the upside target for the rally, but the weekly PMO is decelerating and an upside target could prove to be irrelevant.
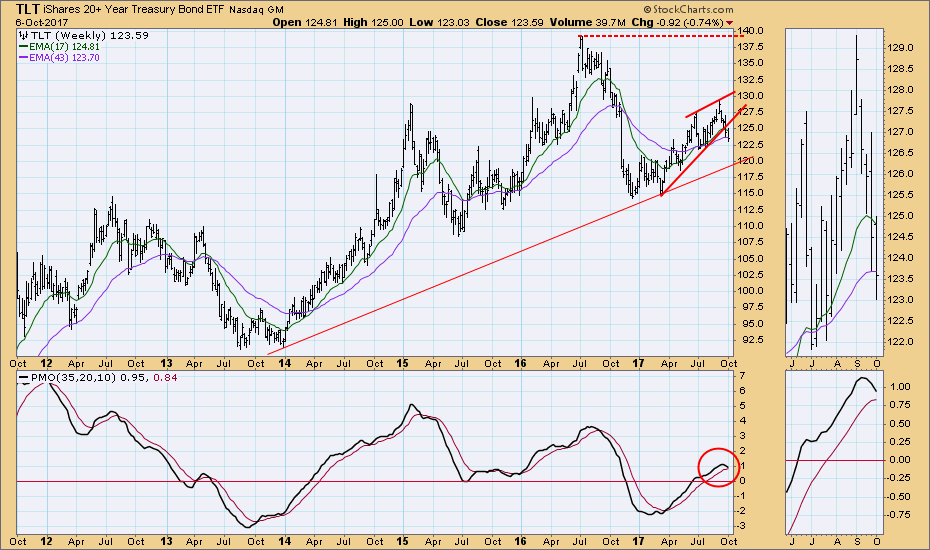
BONDS (TLT)
IT Trend Model: NEUTRAL as of 10/5/2017
LT Trend Model: BUY as of 6/16/2017
The daily PMO topped early last month, and the ITTM BUY signal finally changed to NEUTRAL yesterday, as the 20EMA crossed down through the 50EMA. To clarify, if that crossover were to happen below the 200EMA, the signal would be a SELL.
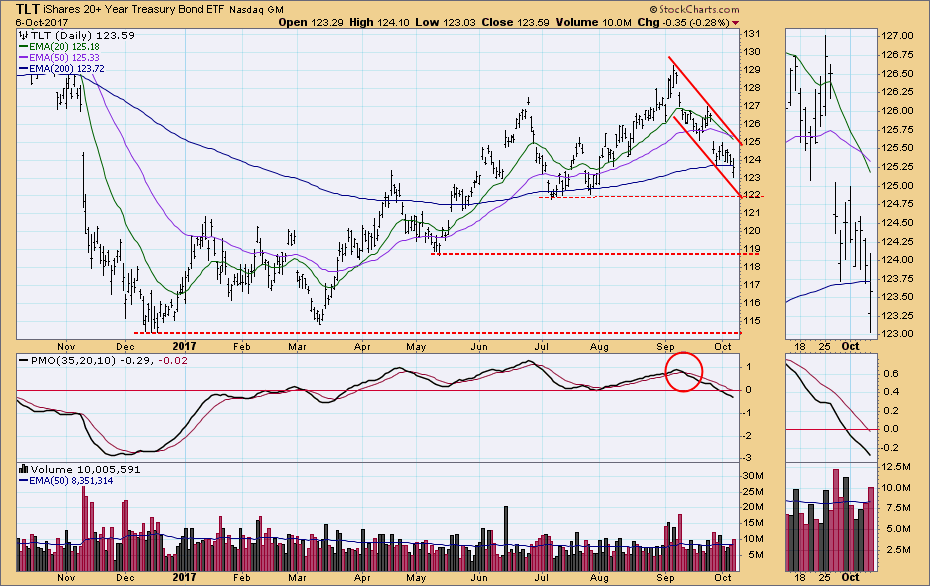
The weekly PMO has topped and price has broken down from a rising wedge formation. While that price breakdown fulfills the technical expectation for the rising wedge, the PMO implies that further price decline should be expected.
**Don't miss any of the DecisionPoint commentaries! Go to the "Notify Me" box toward the end of this blog page to be notified as soon as they are published.**
Technical Analysis is a windsock, not a crystal ball.
Happy Charting!
- Carl
NOTE: The signal status reported herein is based upon mechanical trading model signals, specifically, the DecisionPoint Trend Model. They define the implied bias of the price index based upon moving average relationships, but they do not necessarily call for a specific action. They are information flags that should prompt chart review. Further, they do not call for continuous buying or selling during the life of the signal. For example, a BUY signal will probably (but not necessarily) return the best results if action is taken soon after the signal is generated. Additional opportunities for buying may be found as price zigzags higher, but the trader must look for optimum entry points. Conversely, exit points to preserve gains (or minimize losses) may be evident before the model mechanically closes the signal.
Helpful DecisionPoint Links:
DecisionPoint Shared ChartList and DecisionPoint Chart Gallery
Price Momentum Oscillator (PMO)
Swenlin Trading Oscillators (STO-B and STO-V)