 It is time to start getting into the measures/indicators to be used in the model. Note: When I was presenting at the big wire houses, I used the term measures as seemed to be easier for advisors to understand. Now, dealing primarily with technical analysts, indicators seems more appropriate. At some point I'll pick one and stick with it; just remember they refer to the same thing. We will start with Price-based indicators/measures. Price-based means that the indicator is measuring movement in price instruments; whether it be from an index such as the Nasdaq Composite Average, the S&P 500, or from an individual security, such as an ETF, a stock, a mutual fund, etc. I use the Nasdaq Composite for my price guide because it is a high beta index that contains small caps, mid-caps, large caps, micro caps, technology, just about everything except financials, and has some dogs. If you are going to be a trend follower, then you want to follow a price-based index that moves; it doesn’t matter if it is up or down, it just needs to do so in a big way, and the Nasdaq Composite fills the bill.
A short comment on the highly relative terms of short, medium, and long. You realize terms like this are very different among traders and investors. They are defined individually by a trader’s time frame, risk level, and level of activity that is deemed appropriate. The ones defined below, while still somewhat variable, are what I use.
Price Short Term
The short version of price is more for shorter-term assessment of trendiness. It is simply looking at the price relationship in the 10 to 21-day range. If you were using multiple price measures on the same index, then this is the one that would turn on first and turn off first; it is the quicker to respond to changes in price direction. Many times, a short-term measure is not actually used in the weight of the evidence calculation but serves a weight of the evidence model well with a warning of things to come. Sort of a heads-up alert.
Price Medium Term
This Price Medium measure is basically looking at the price relationships over a 2 to 4-week period. If the short-term price measure isn’t used, then this is the one that will lead the change in direction of the index being followed.
Price Long Term
This price trend measure is like Price Medium but looking at the price relationship over a 4 to 8-week period. Generally, the Price Medium indicator will turn on first and if the trend is sustained the Price Long measure will turn on thus providing confirmation of the trend and further building the point total of the cumulative Weight of the Evidence.
Chart A is an example of the Price Long measure. While this is entirely too much data on one chart, you can focus on the digital overlay on the top plot and can see that it does an excellent job of tagging the uptrends, which is all we want it to do. Don’t forget that tagging the uptrends, also means tagging the down and sideways trends. Chart A begins in late 1999 up to current.
 Chart A
Chart B shows the same price measure as the one in Chart A, just for a shorter period of time. It becomes much clearer that the digital line overlaid on the top price data moves in conjunction with the indicator in the bottom plot, the Price Long measure. Whenever the Price long indicator moves above the horizontal line, the binary moves to the top, and whenever the Price long drops below the horizontal line, the binary drops back to the bottom. You can then see that whenever the binary is at the top, it is signaling an uptrend and whenever it is at the bottom it is signaling no uptrend (down trend or sideways). This concept was beat to death in this earlier article. This concept is quite valuable since it allows you to view only the digital to know what the indicator is doing. So, is this indicator perfect? Of course not, you can see there were some whipsaw signals (short and wrong, but also quickly reversed) sprinkled around. As I have said before and will no doubt say again, I know these measures will be wrong at times, but they are not going to stay wrong because they react to the market. Since these indicators are all trend following, they will reverse a wrong direction almost as fast as they identify it in the first place. That is exactly what you want them to do and it is also why I use a weight of the evidence approach which means I rely upon a basket of technical measures. Sort of a democratic approach, if you will. And don’t forget this is just one of the measures used in the weight of the evidence. Chart B starts in 2015.
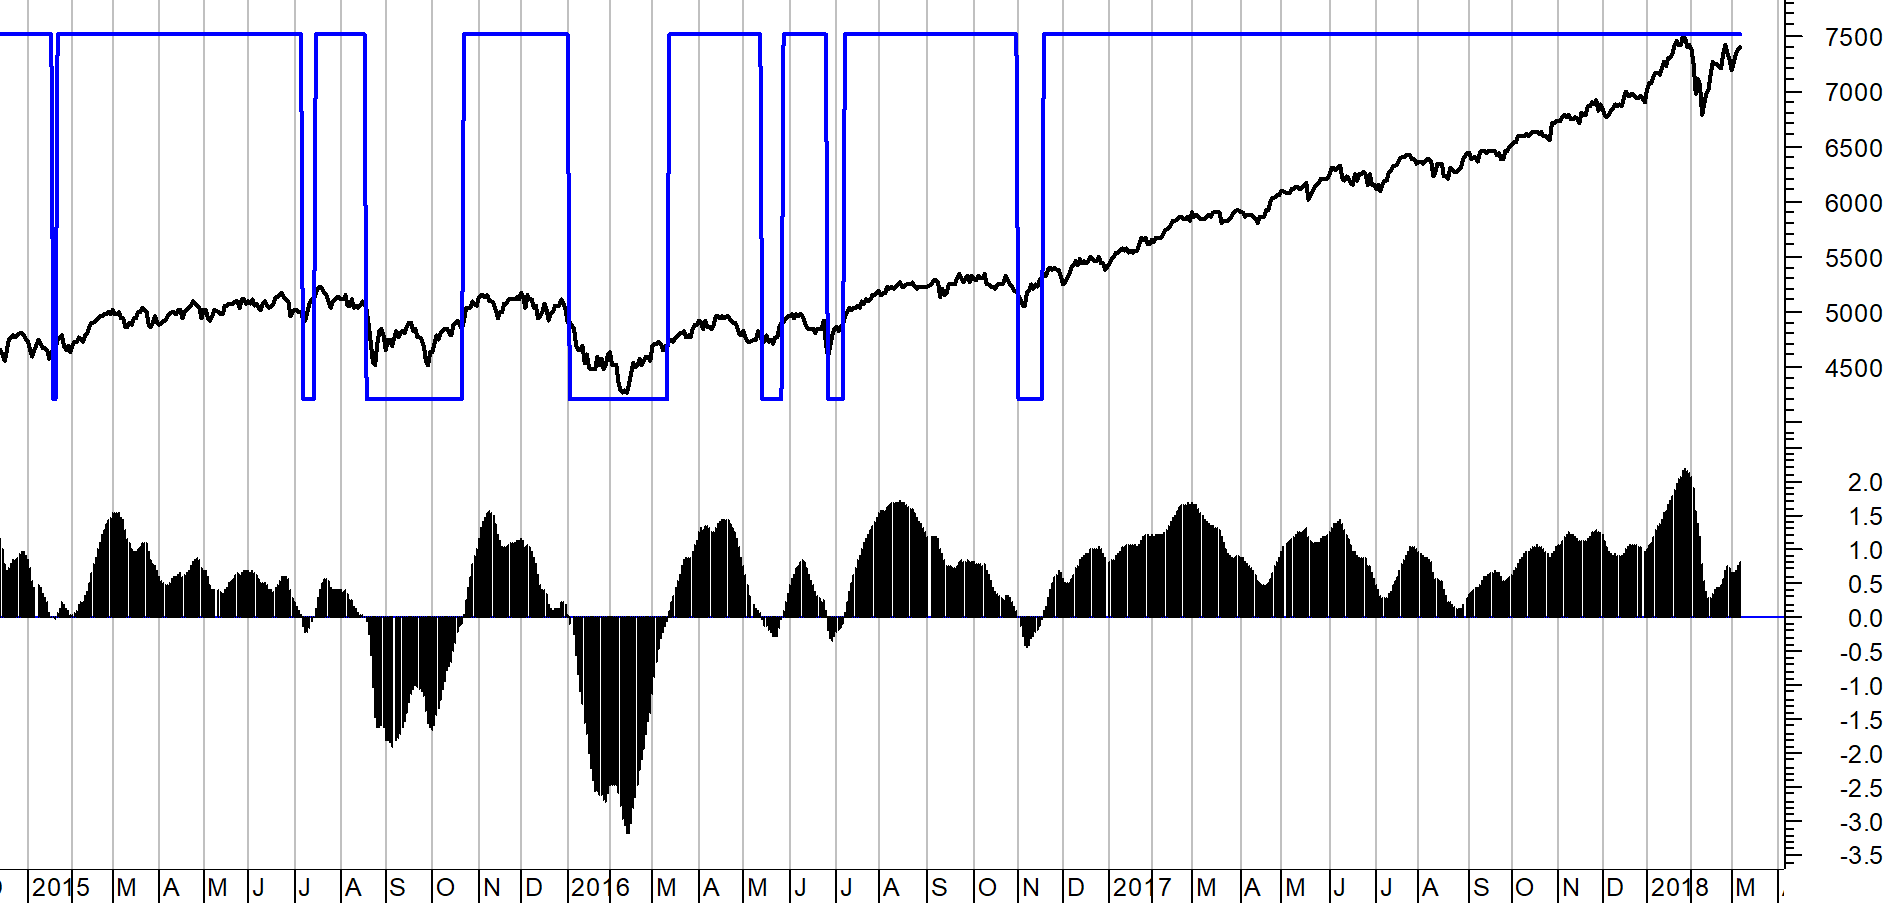 Chart B
Please understand that I cannot give you the exact formulae for these indicators because this model is still a working model used by money managers. However, I can explain the process and offer solutions that should allow you to experiment with your versions of these measures. Chart C is the Nasdaq Composite with MACD in the bottom plot. You will notice that MACD is a close approximation of the indicator used in Charts A and B (using the same time frame as Chart B). The two exponential averages used to calculate MACD are the 19 and 39-day. Nineteen days is almost 4 weeks and 39 days is over 7 weeks which fits the description of Price Long mentioned earlier. That should give you enough information to know what the numbers are for the Price Medium measure.
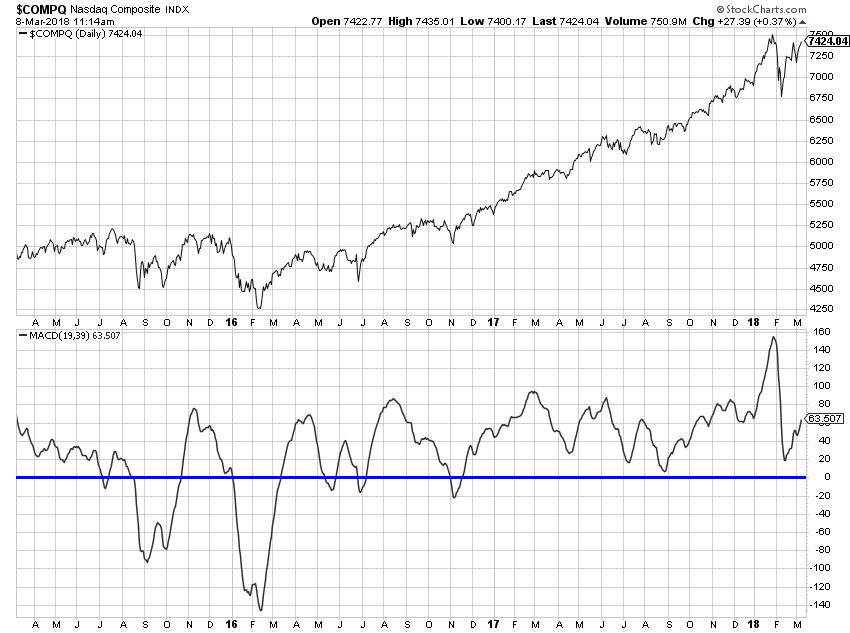 Chart C
A rules-based trend following model should have price-based measures using different time frames. I use the medium and long term described in this article. A version of the Price Short measure will be used and explained later in an article about Early Warning Measures. Later I will cover some additional price-based measures and show a sample of performance statistics used to help determine best parameters.
Dance with the Trend,
Greg Morris