 I rarely, if ever, discuss the current market or offer any market analysis. StockCharts.com has many expert technical analysts that already do a bang up job on this. However, since I am writing a series on Building a Rules-Based Trend Following Model, I thought I would tell you how the model has worked over the past week or so. At this point in the series I cannot detail everything that you will see in these charts for this article. I will keep it fairly simple as we will dive into more detail as the series evolves. As I cover Chart A and Chart B below, it might seem like I’m leaving out a lot of detail; I am and doing so on purpose. This was a last-minute idea to show you what the current model is actually doing. This is not where I am going to cover all the details; those will be presented in a more orderly fashion in the Building a Rules-Based Trend Following Model series. Notice that I have already abandoned the use of BaR-BTFM like I did in part 3 of this series. Sometimes what seemed like a good idea turns out to be just plain wrong later.
I have often mentioned that I use the Nasdaq Composite Index for everything in my model, including the Nasdaq breadth. I like the Nasdaq Composite because it contains everything; not as much in the financial sector but has all the rest. It has most of the sectors and industry groups, including large caps, mid caps, small caps, micro caps, and dogs.
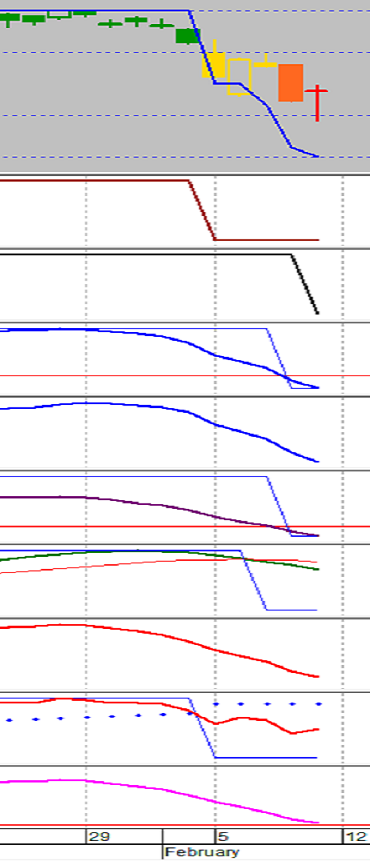
The top plot in Chart A is the Nasdaq Composite using candlesticks. The blue line is the total Weight of the Evidence and heart and soul of the model. It has dropped from 100 down to 30. As the model declines, the stops on all holdings are tightened. Hence, the model had me partially out on Friday, Feb. 2nd, and totally in cash the next Monday morning, Feb. 5th.
The remaining plots are the nine Weight of the Evidence components with their digital signals. You can see that 7 of the digitals have dropped to “off” and only two remain “on.” And those two are really close to going “off.” The two that are still “on” are the bottom plot and the 3rd from the bottom. You cannot see the digital because of the condensed view.
The nine Weight of the Evidence indicators consist of one relative strength compound measure and one trend compound measure. There are five indicators using market breadth and two using price. At some point in the series I'll even explain my color coding, which I believe is an important part when using charts.
A fair question you might ask is what will the model do going forward. With the significance of the drop, even with a couple of good up days, the trend measures will take a while to reverse if the market were to shoot up quickly. That is one of the downsides of trend following, but is certainly better than guessing. If the market continues down; then I'll play more golf.
Chart B shows the Nasdaq Composite along with the Weight of the Evidence digital since the middle of September 2017. The color of the candlesticks is the color of the Weight of the Evidence levels. I am not prepared to get into that process as that is much further down the road.
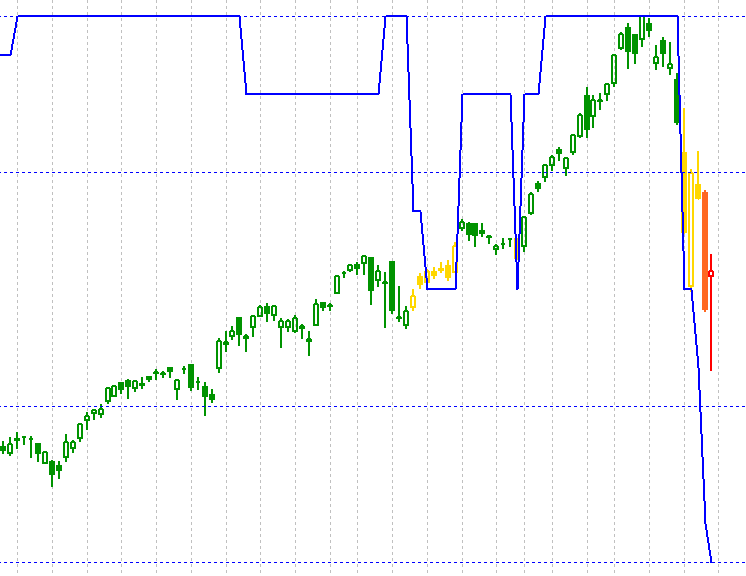 Chart B
I apologize if this article seemed vague; I just wanted you to see that we are using a real trend following model that has managed a great deal of money over many years. Over time I will update you on the model when there are significant changes. I also hope you fully understand that exact details of the model will not be divulged because this is a model currently in use. You will, however, get enough information to build your own.
Dance with the Trend,
Greg Morris