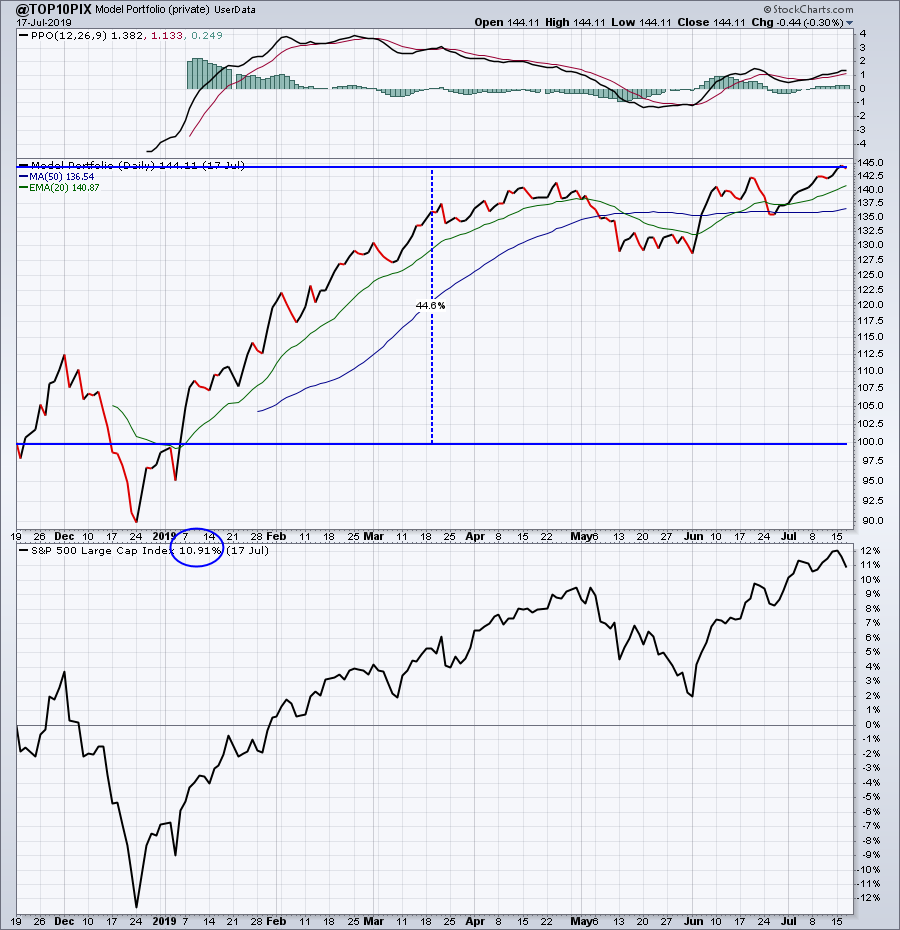
As you may already know, I've developed multiple portfolios using fundamental strength and technical price action, including relative strength, that have wildly outperformed the benchmark S&P 500 since their inception dates. I'm very excited about that, as well as the prospect of helping thousands of you to do the same. My primary Model Portfolio was launched on November 19, 2018, in the midst of a severe market correction and was not at all deterred by that market drop. In fact, the Model Portfolio recovered much faster than the S&P 500, as Wall Street is consumed by companies that are market leaders. I am too, and have based my portfolio selection on this premise. To illustrate just how strong the combination of solid fundamentals (i.e. better-than-expected quarterly results) and relative strength can be, check out these results going from that November 19, 2018 launch through the Wednesday, July 17th close (I'd have updated through the July 19th close, but I am currently out of town):
Model Portfolio: +44.11%
S&P 500: +10.91%
Here's a visual:
 (Note: If you click on the above chart to see the "current data," it won't update past July 17th. It's a User-Defined index where the data is in my StockCharts.com account. I have to manually enter this data every day and I won't be updating it until next week.)
That's a lot of outperformance. While I certainly wouldn't expect that type of outperformance in the future (nor should you), I can say that my Model Portfolio has outperformed in every quarter since it was launched. Investing in leaders pays big dividends. After seeing relative strength at work in selecting my 10 favorite equal-weighted stocks in my Model Portfolio since November, I decided to launch two additional portfolios - an Aggressive Portfolio for those seeking higher returns with higher risk and an Income Portfolio for those wishing to take on less risk but still keep up with the S&P 500. That latter portfolio is designed to better weather market downturns while still providing great returns during market uptrends. These two newer portfolios launched with a webinar with the EarningsBeats.com community on May 19, 2019. Here are the results of all three portfolios since that date (through Wednesday, July 17), compared to the benchmark S&P 500:
Model Portfolio: +10.74%
Aggressive Portfolio: +12.30%
Income Portfolio: +4.76%
S&P 500: +4.37%
Outperforming the benchmark S&P 500 by such a wide margin with both the Model Portfolio and Aggressive Portfolio is unbelievably impressive when you consider that 80% of mutual funds underperform the benchmark S&P 500. Also, consider this: the Aggressive Portfolio has 7 small cap stocks, 2 mid cap stocks and 1 large cap stock, and the small cap Russell 2000 has been awful. Imagine what this Aggressive Portfolio might do if money actually begins rotating into small caps!
While on the surface, the Income Portfolio's performance might seem rather mundane, consider that there is only one technology stock in the portfolio and zero consumer discretionary stocks. These are the two sectors that have performed so well and have led the S&P 500 higher. Instead, this group looks to safer stocks first. There are two food products companies, a railroad, a personal products company and a waste disposal company among the ten holdings. It's not exciting. It's not fancy. But it's a solidly performing portfolio with an average dividend yield of nearly 2%. It's for income-oriented investors that want relative leaders to provide capital appreciation as well.
I provide commentary in EarningsBeats.com's FREE newsletter, which focuses on fundamental earnings information, along with technical indicators. I'd highly recommend you SIGN UP and learn more about relative strength, which is a primary focus in this newsletter.
Since reaching highs in January 2018, the S&P 500 had been stuck in sideways consolidation for a year and a half. I believe that consolidation has ended. In my last ChartWatchers article two weeks ago, "Why U.S. Equities Are Poised For Another 40-50% Surge", I suggested watching two very important charts. The first was the 10-year treasury yield ($TNX) and the other was the relationship between transportation stocks and utilities stocks ($TRAN:$UTIL). Both are trying to turn higher and, in the past, their rise has coincided with extremely bullish S&P 500 advances.
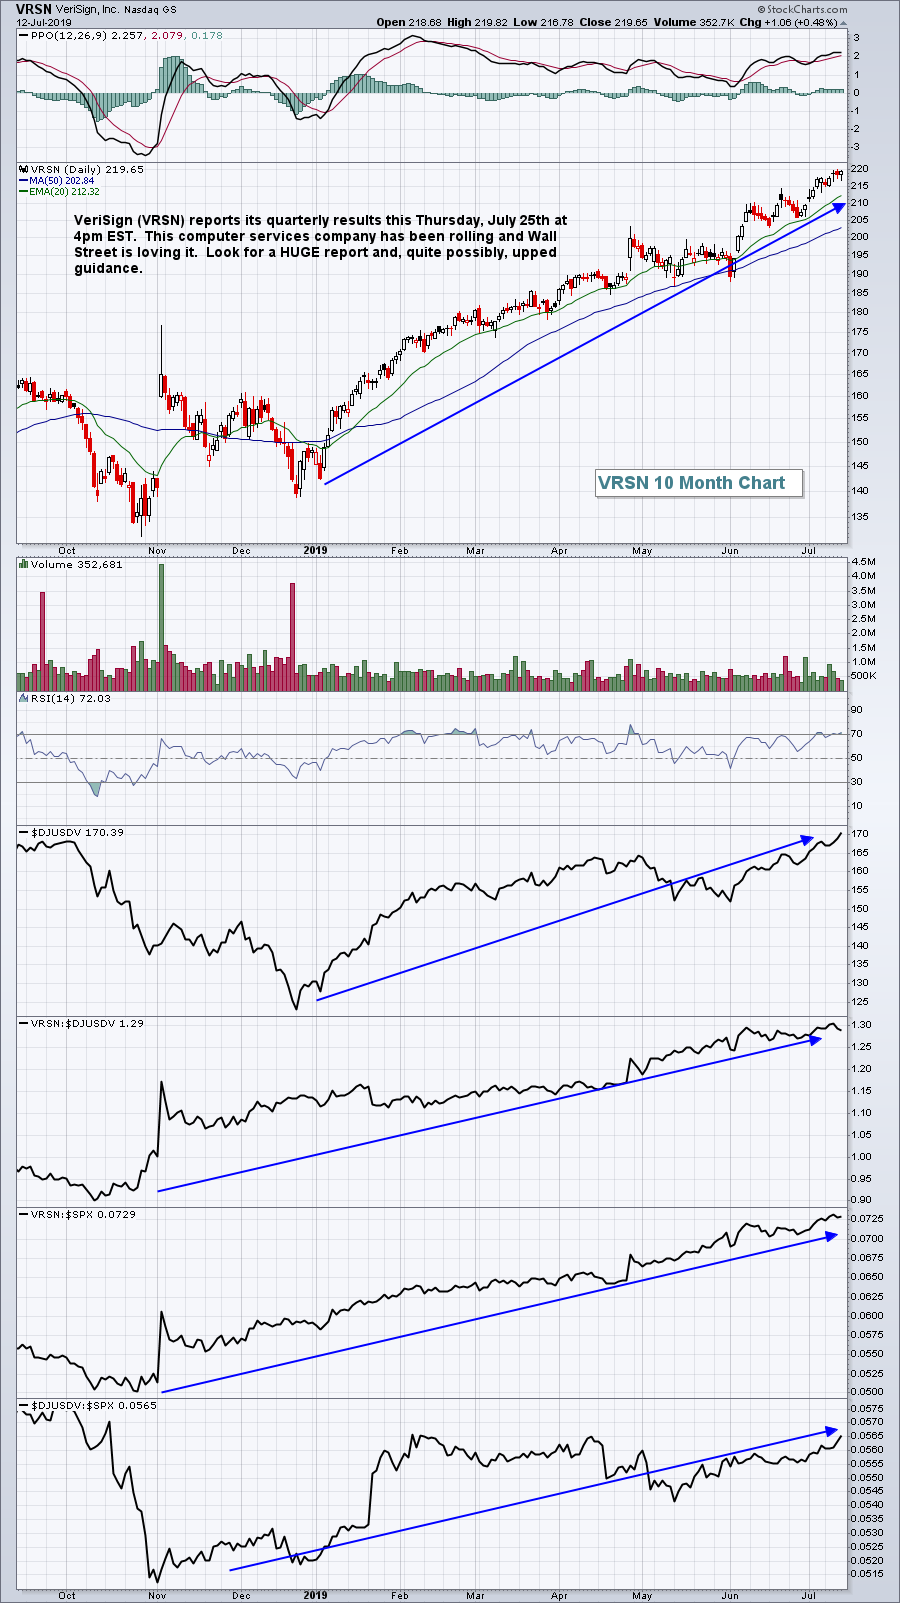
The best way to take advantage of a market advance is through relative strength. While the S&P 500 could go up 40-50% over the next 18 months to two years, we'll have opportunities to increase our investment worth far more than that if we understand and benefit from relative leadership. To that end, we're already seeing significant earnings-related advances in technology (XLK) and consumer discretionary (XLY) stocks, as that's where Wall Street has placed its bets heading into this earnings season. I'll give you a few companies poised to deliver the goods:
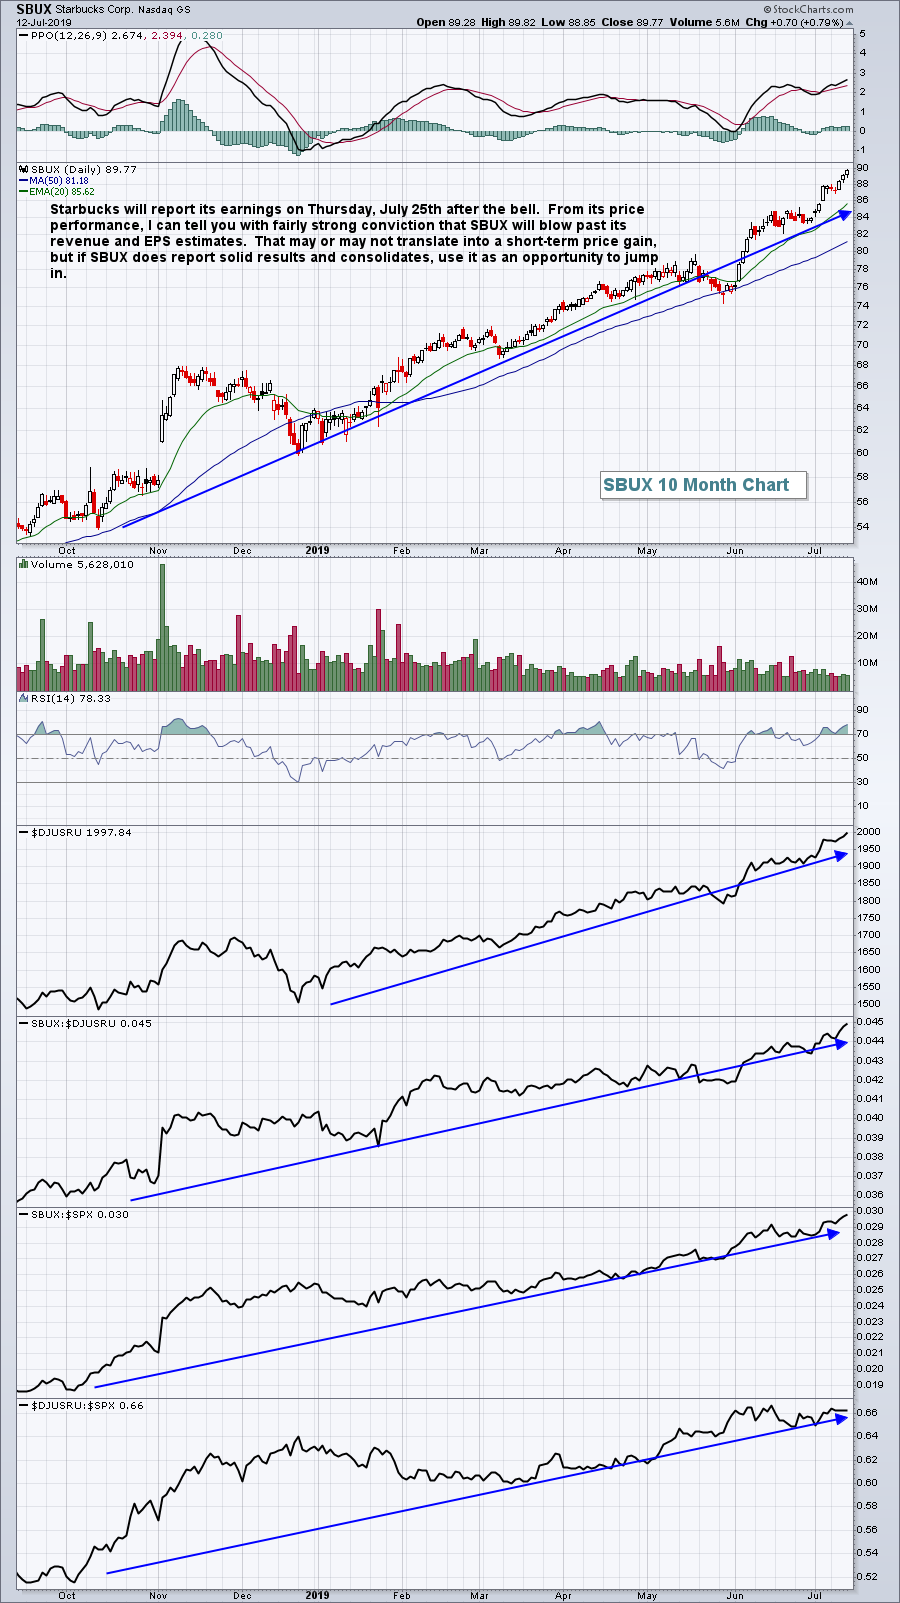 Want another? Check this one out....
 Now the big question becomes..... where do I get in? It's already gone up so much, right? Well, let me give you an example of a stock that I currently own that was doing the same thing SBUX and VRSN are doing right now. Do you recall how Chipotle Mexican Grill (CMG) looked before its last quarterly earnings report?
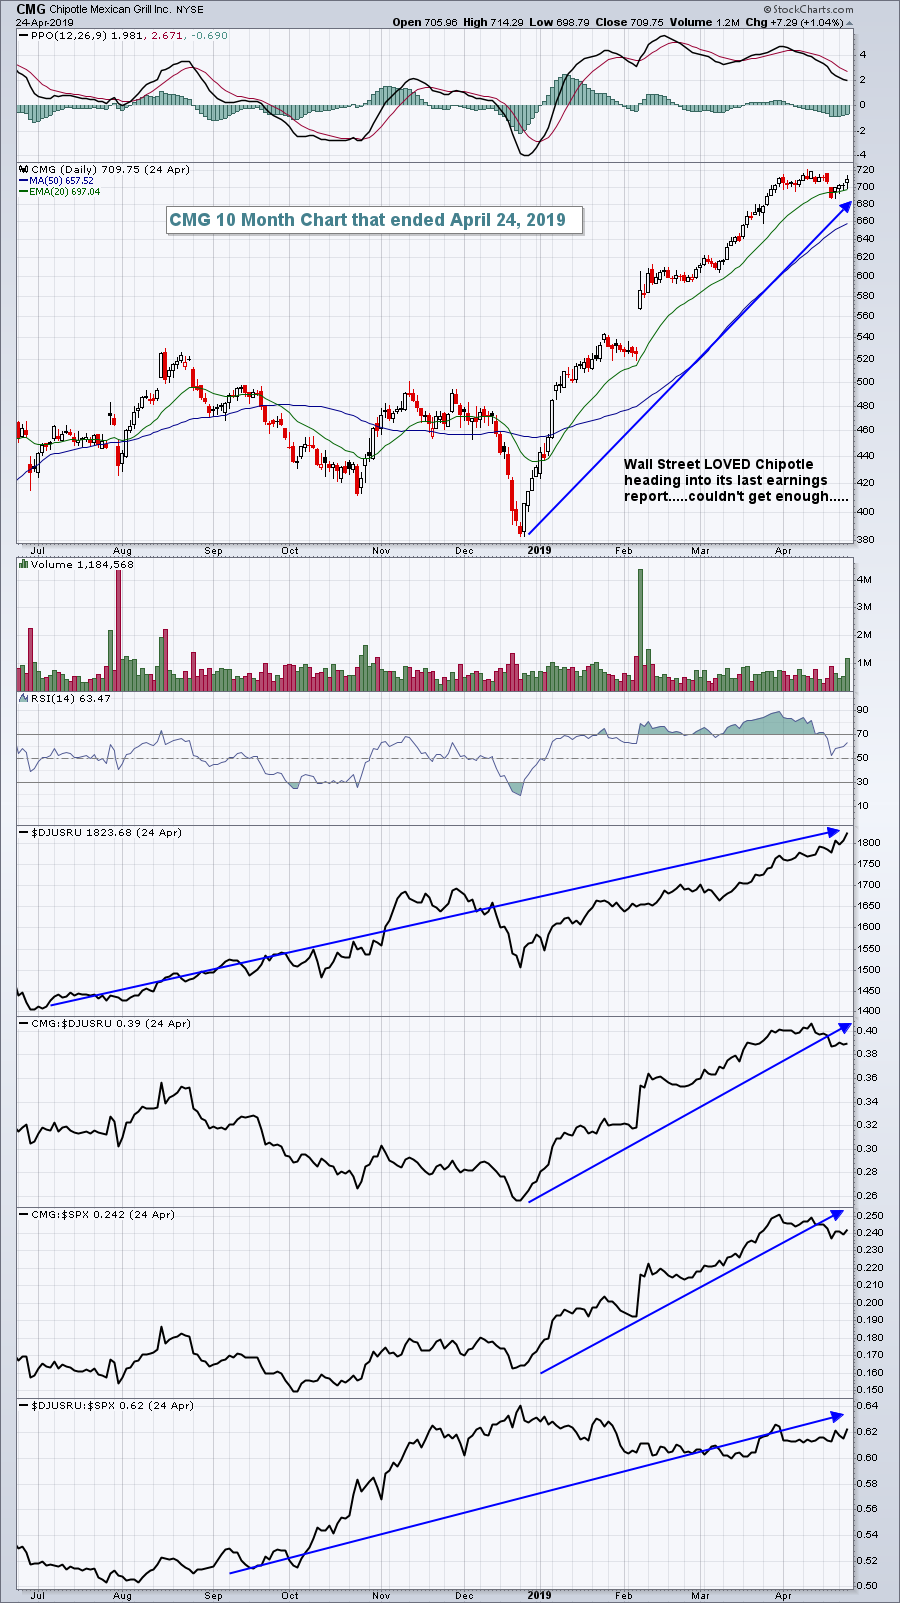 .....and then this happened after earnings:
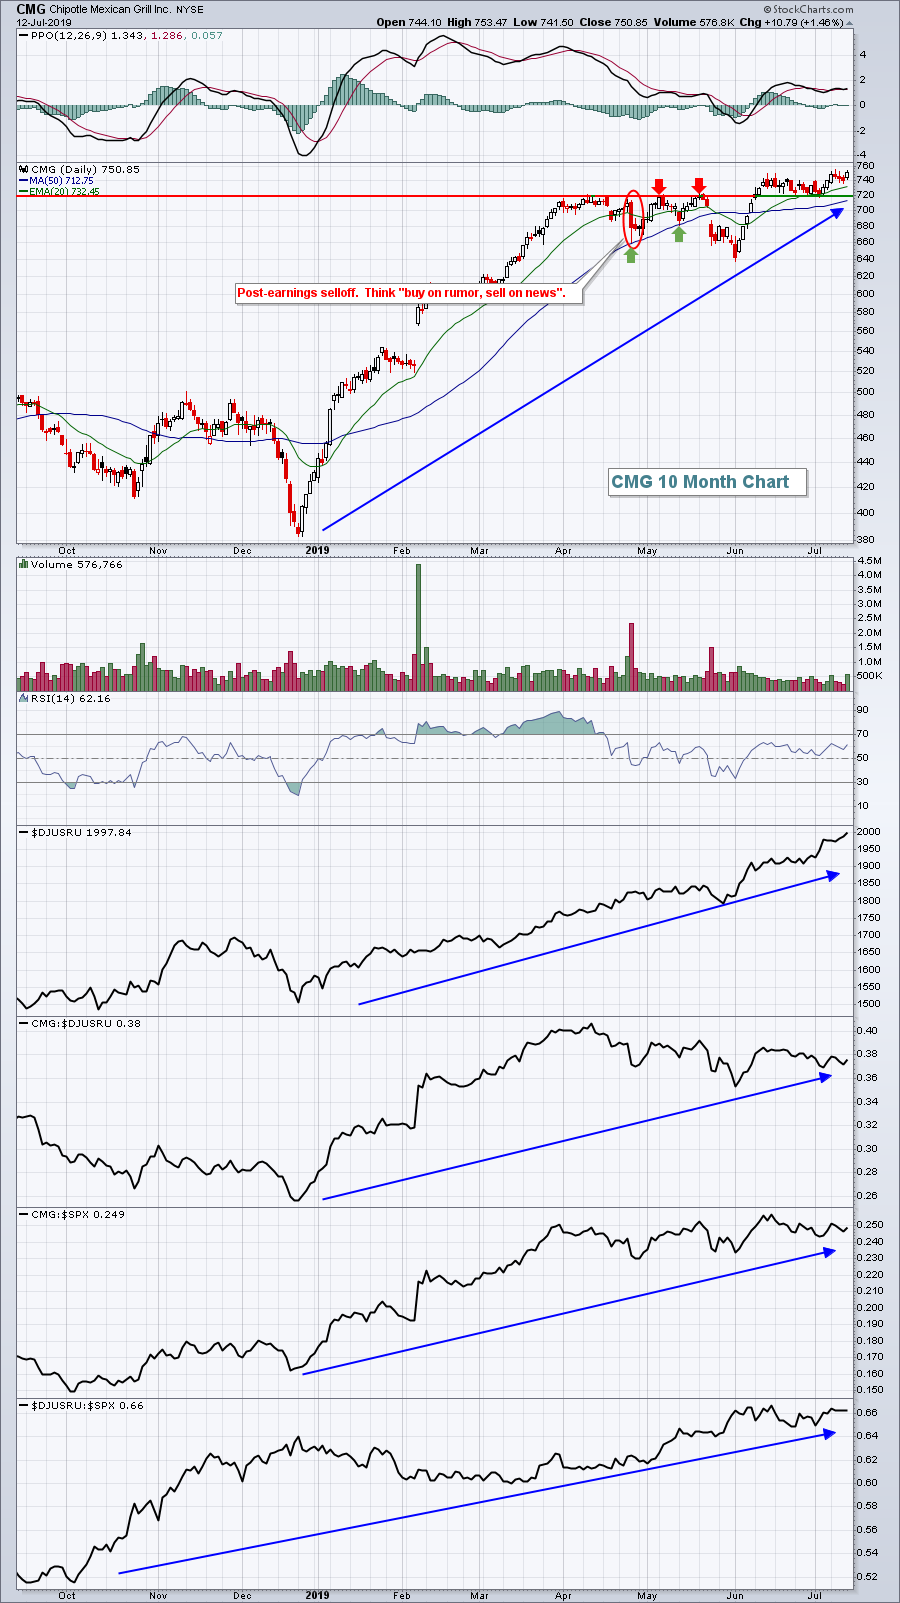 CMG reported much-better-than-expected results. They beat on both the top line (revenues) and bottom line (EPS). There was nothing at all wrong with their report - it was simply a "buy on the rumor, sell on the news" mentality that provided us with an opportunity. This may or may not happen with SBUX and VRSN, but if they blow past Wall Street consensus estimates, a future pullback would likely represent a super buying opportunity for the next advance in the S&P 500.
Solid fundamentals and exceptional technicals should be the backbone of your investing/trading strategy if your goal is to beat the benchmark S&P 500. Follow me and I'll do my best to lead you, on a relative basis, into 2020 and beyond. To that end, you should first consider joining the EarningsBeats.com Digest, a FREE newsletter that I contribute to along with John Hopkins. CLICK HERE to sign up. In his last ChartWatchers article, John pointed out Cintas Corp (CTAS) as a stock likely to report blowout earnings based on his relative strength analysis. Here was the S&P 500 leaderboard on Wednesday, the day after CTAS reported blowout revenue and earnings:
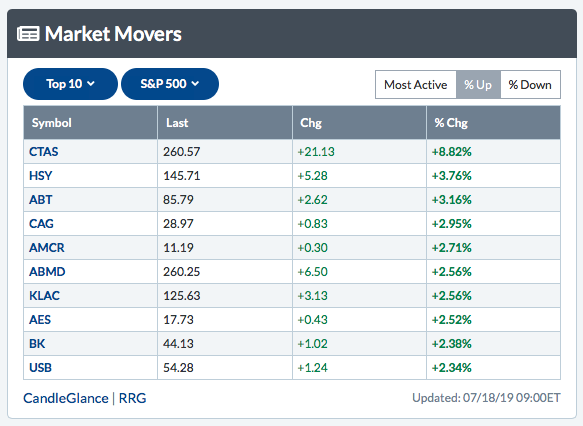 The second stock listed, Hershey's (HSY), is a component of my Income Portfolio. Relative strength analysis works!
Happy trading!
Tom
