About a month ago, I wrote an article for ChartWatchers titled “Five Trendlines You Should Be Watching.” The general idea was that, as long as those five trend lines held, then the market was still most likely in a very constructive phase.
Revisiting those trend lines here will show that the picture has changed dramatically in just four weeks, presenting a more bearish outlook for the equity markets.
1) Nasdaq 100 Index
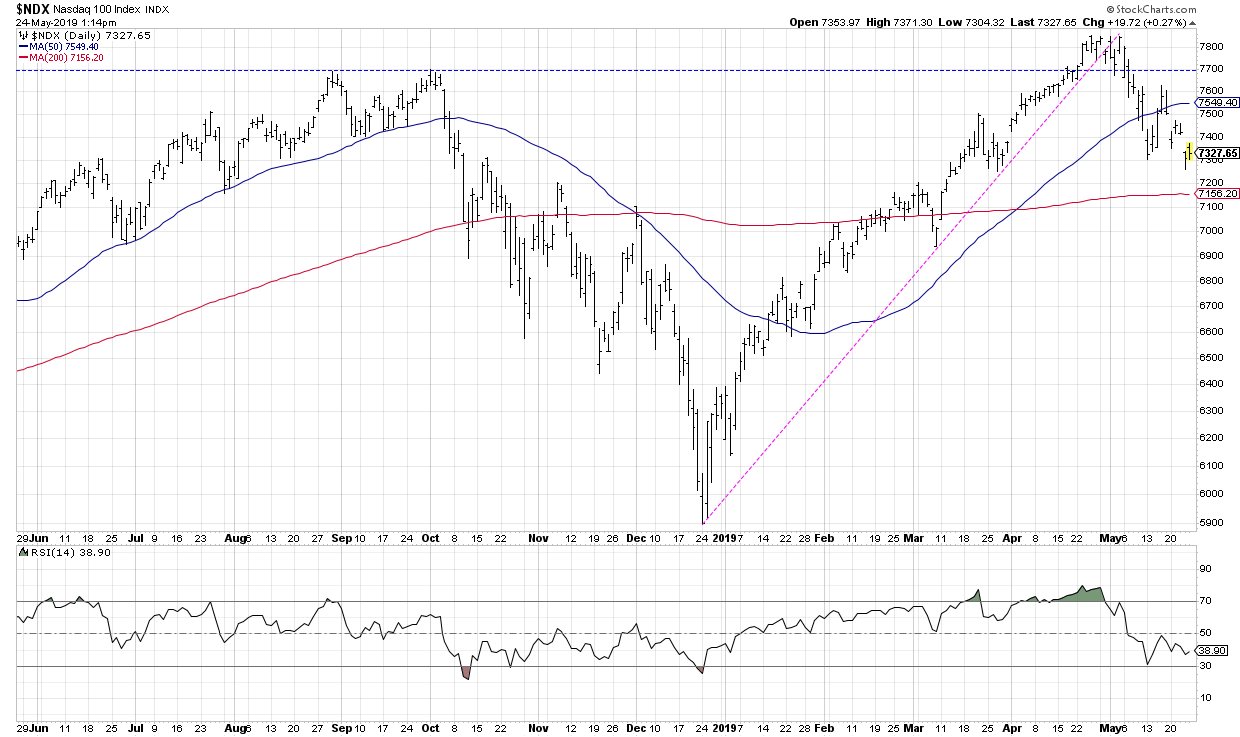 This was a key chart for me, as it represented the mega cap technology leadership that drove the market higher in the first four months of 2019. This trend line break was the most important in terms of acknowledging a potential sea change within equities.
2) Semiconductors
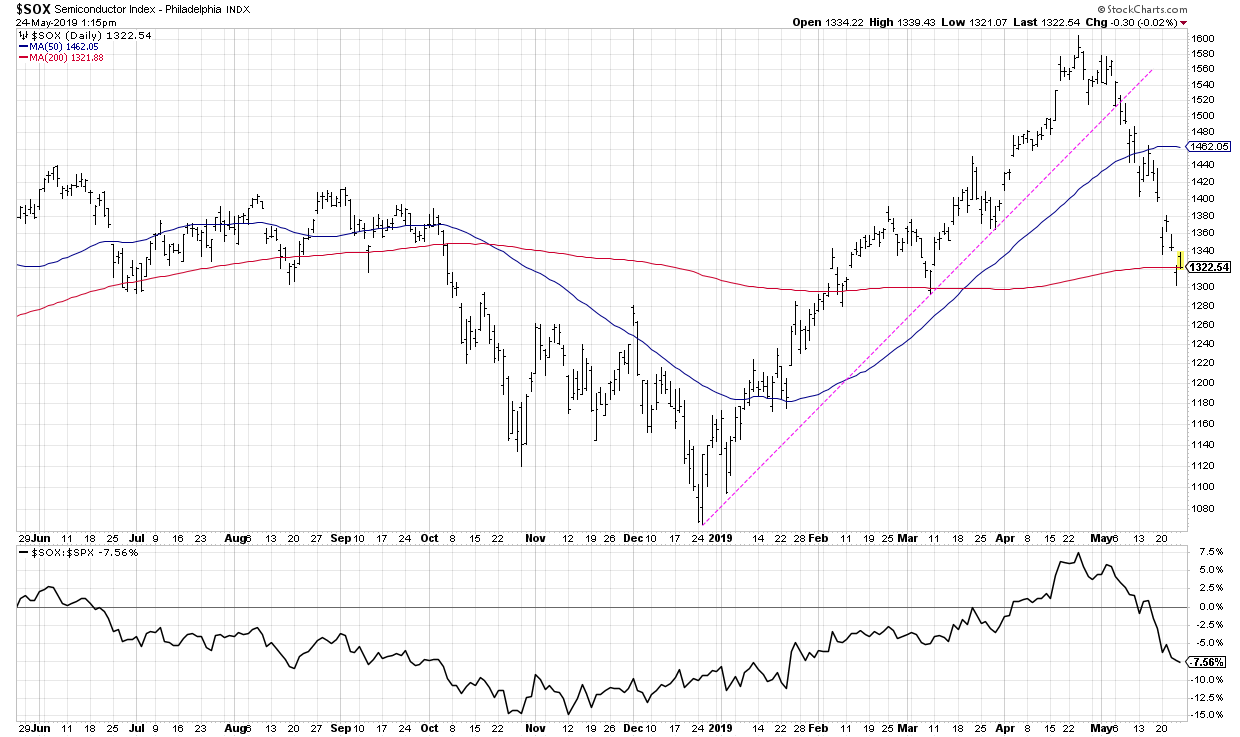 The market has rarely gone meaningfully higher without semiconductors participating in the upswings. The SOX has broken trend line support and is now testing the 200-day moving average around 1320. A confirmed break below 1300 would suggest further lows and underperformance.
3) Microsoft
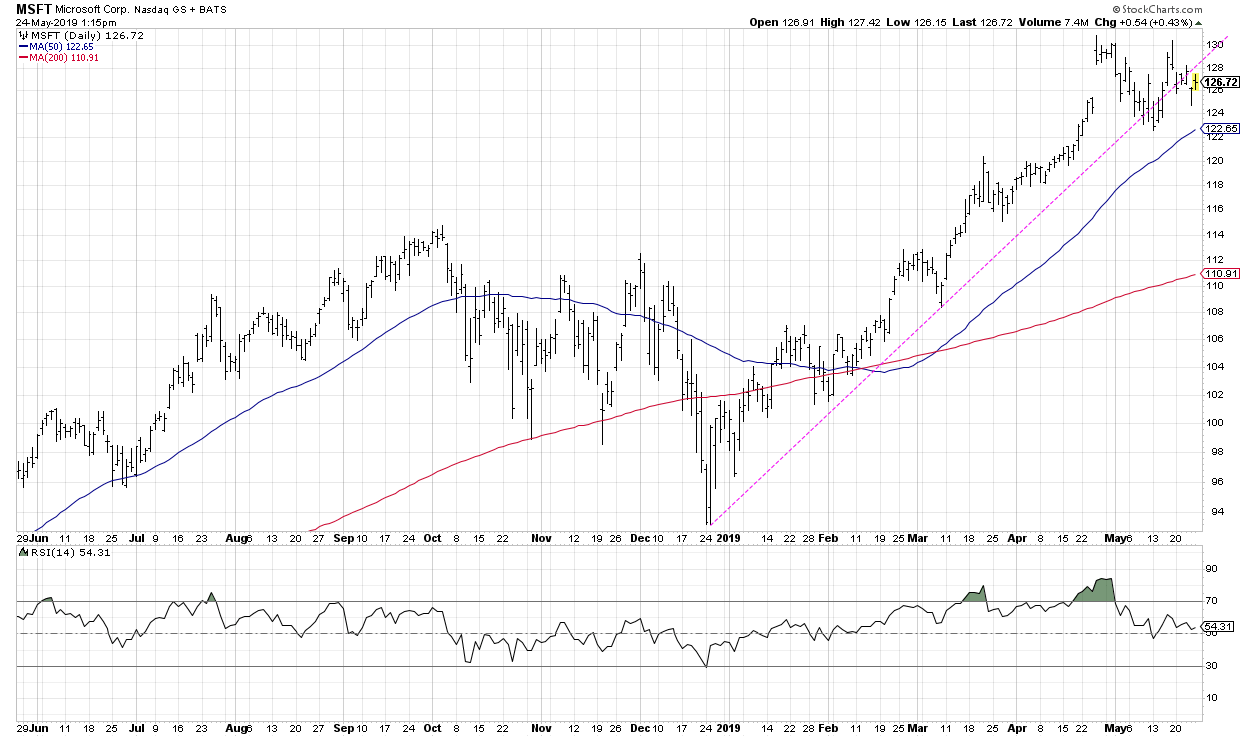 Microsoft is perhaps the least painful of the bunch, as it has broken the trend line a number of times but hasn’t really confirmed the break yet.
To confirm a trend line break, I usually look for a close through the trend line, followed by confirmation when the price moves even further in the direction of the breakout. This suggests that any resistance to the move has been overwhelmed and the price is likely to continue in the direction of the breakout.
It’s also worth noting that Microsoft remains the largest company in the world by market cap. The fact that MSFT has not confirmed a downside breakout is one of the reasons why charts like the SPX don’t look nearly as bad as they could.
4) Amazon
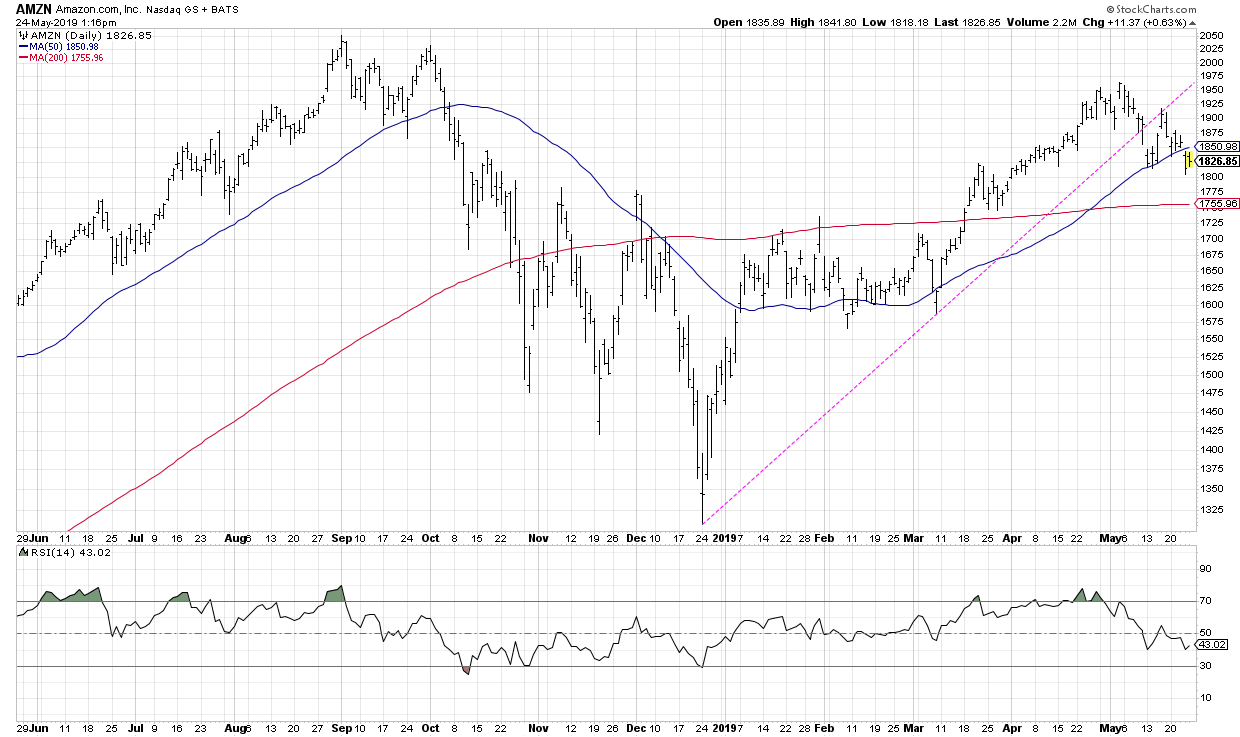 Amazon has now confirmed a downside break of trend line support and is in the process of violating the 50-day moving average as well. The 200-day moving average looms large at around 1750.
5) Offense vs. Defense
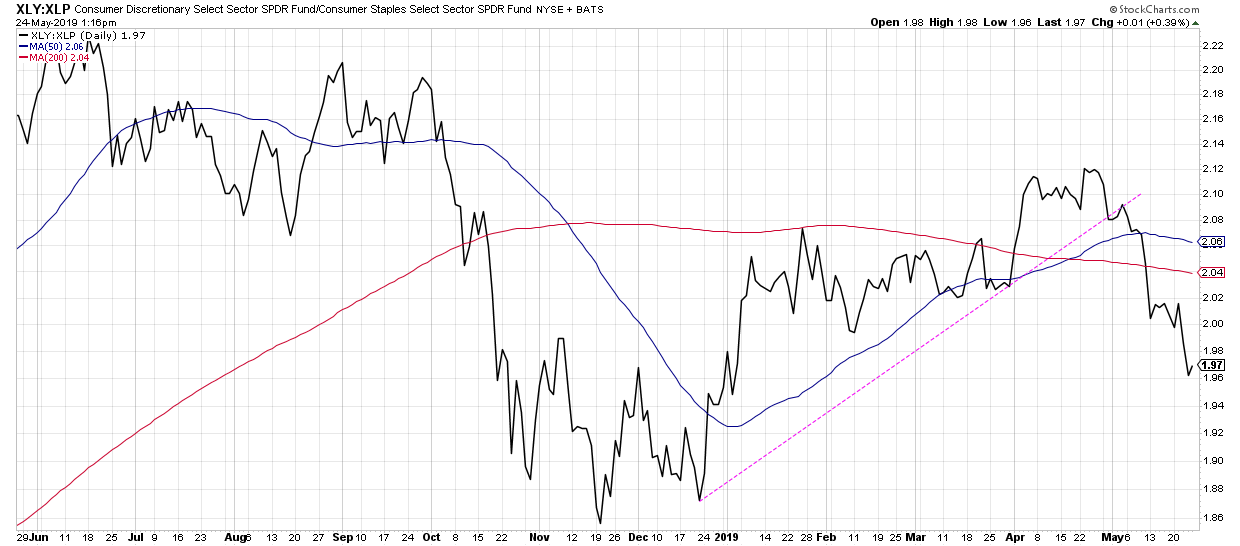 I love to use this ratio as a barometer of risk on vs. risk off within the consumer space. The ratio has confirmed a breakdown of the trend line and is now in an established downtrend. This suggests a rotation more toward the defensive side of the consumer sectors.
It’s worth noting that I actually included a sixth trend line in the original article, using a chart of bond prices in the form of the AGG ETF.
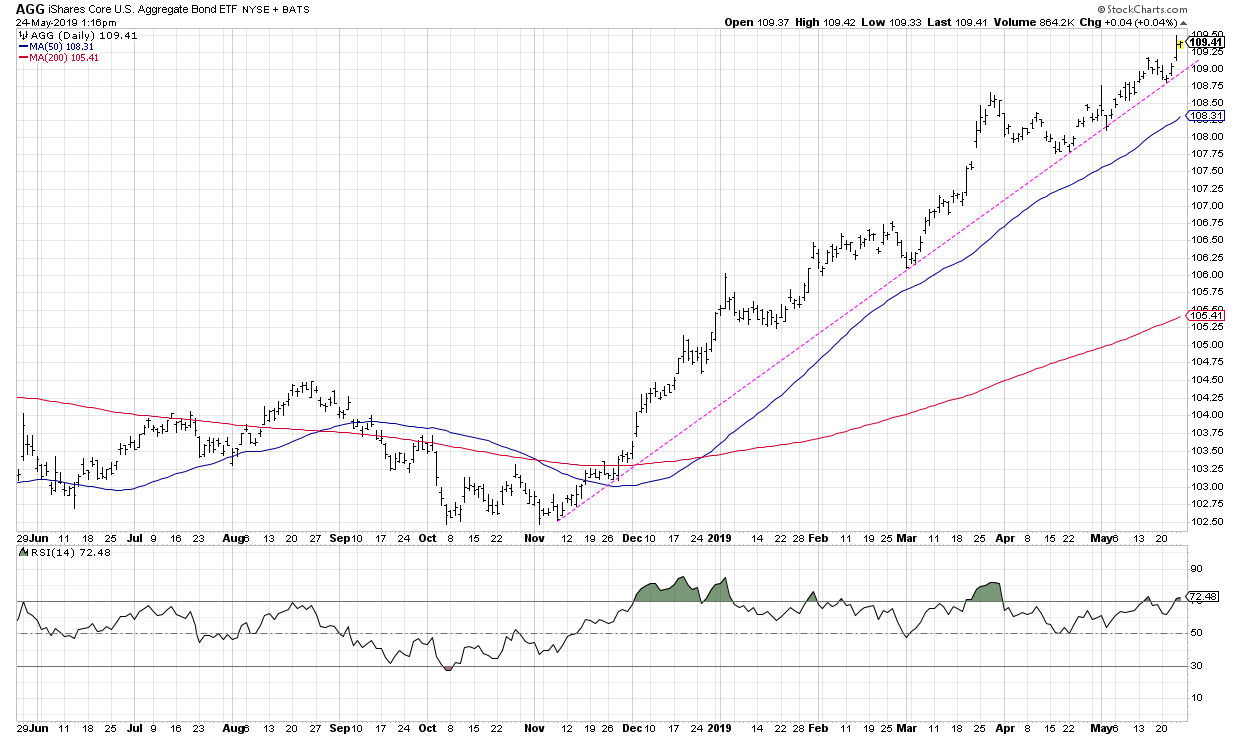 I added this chart to the article in a later version because, although it represented a very different market than the other five charts, it was still a chart in a consistent uptrend that deserved attention.
Not surprisingly, this is the one trend line that has actually remained unbroken during the recent market turmoil. Bonds remain in a cyclical bull market and continue to run higher unabated. Charts like AGG have become overbought numerous times over the last six months, but, in each instance, the chart has continued higher.
At some point, that pattern of higher highs and higher lows will break. A violation of trend line support is what may finally signify that the cyclical bull market in bonds is over. Until then, the trend is up!
RR#6,
Dave
David Keller, CMT
President, Sierra Alpha Research LLC
Disclaimer: This blog is for educational purposes only and should not be construed as financial advice. The ideas and strategies should never be used without first assessing your own personal and financial situation or without consulting a financial professional.
The author does not have a position in mentioned securities at the time of publication. Any opinions expressed herein are solely those of the author and do not in any way represent the views or opinions of any other person or entity.