ChartWatchers October 20, 2018 at 04:45 PM
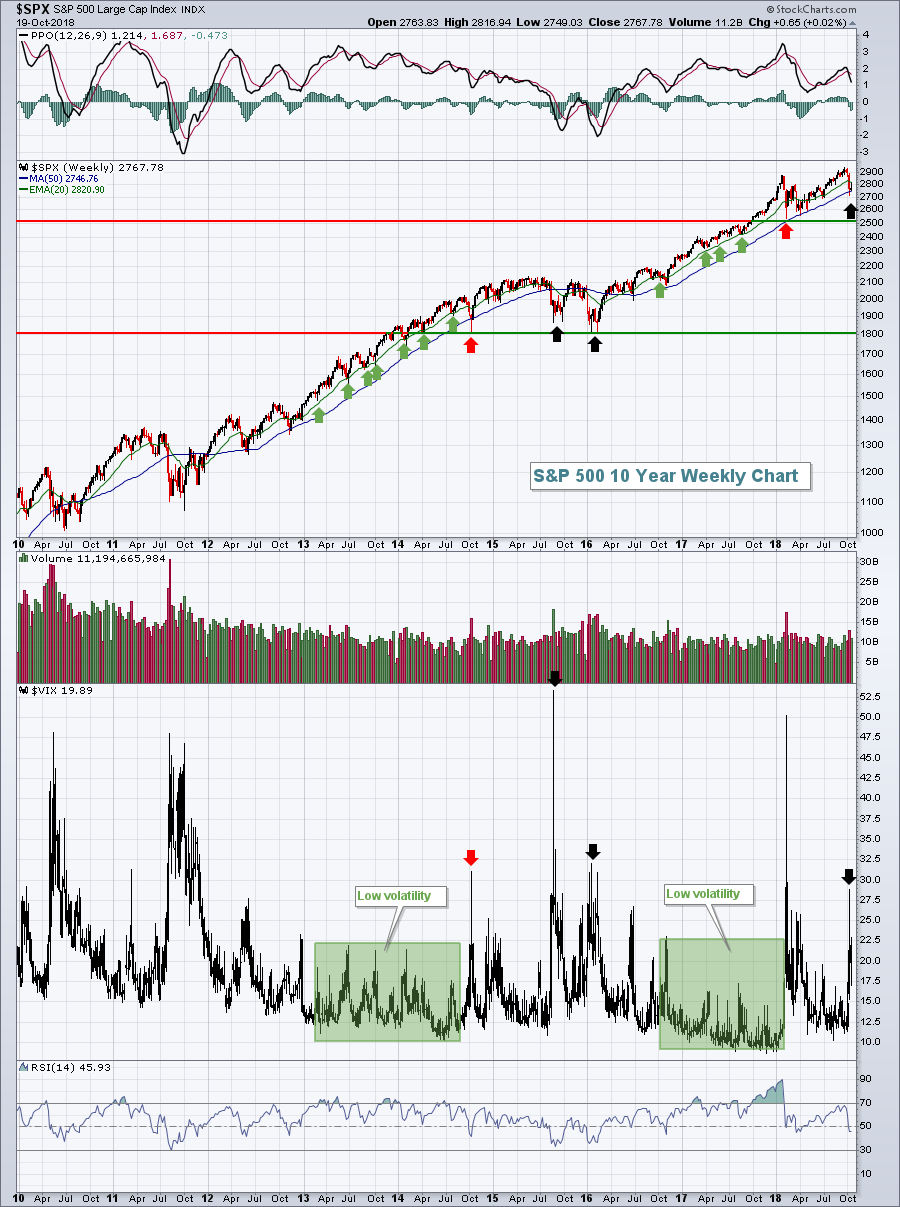
There are plenty of reasons why we should be cautious given the current market environment, but I'm not in the camp that believes we've entered a bear market. It's simply too early to make that call, in my opinion... Read More
ChartWatchers October 20, 2018 at 04:12 PM
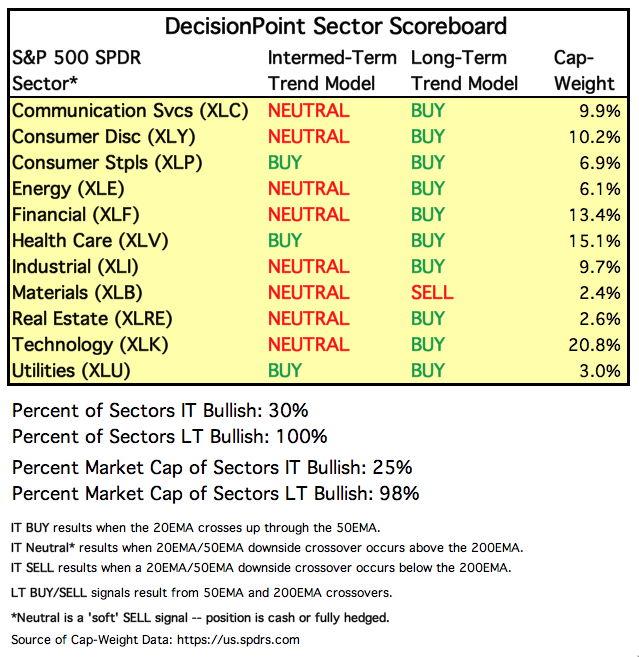
If you've explored the member dashboard, read a DP Alert or checked into the DecisionPoint Chart Gallery, you are likely familiar with our DecisionPoint Scoreboards for the SPX, OEX, INDU and NDX. What you may not have uncovered was our DecisionPoint Sector Scoreboard... Read More
ChartWatchers October 20, 2018 at 02:13 PM
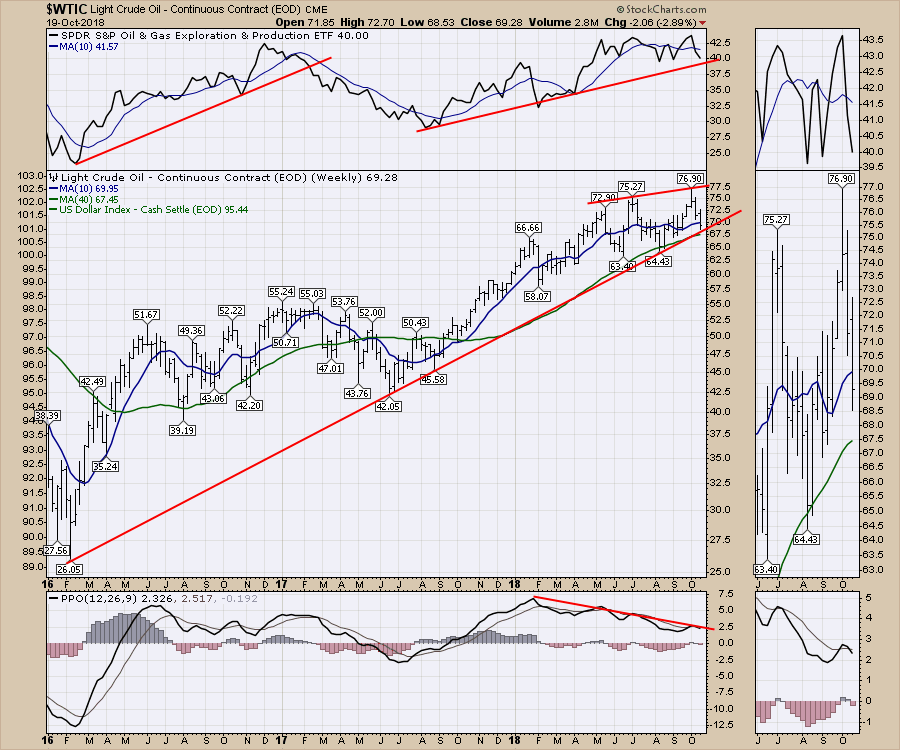
The setting couldn't be more climactic. Oil, seems to be generating attention from the world through Saudi Arabia, Iran, Russia, pipelines, global slowdown, trade pressures with China, EU issues in Germany and Italy, Brexit, Steel tariffs and the list goes on... Read More
ChartWatchers October 20, 2018 at 11:00 AM

Editor's Note: This article was prepared jointly by Julius de Kempenaer and Arthur Hill with assistance from members of the StockCharts data and business teams... Read More
ChartWatchers October 20, 2018 at 02:38 AM

One of my favorite methods for analyzing the sector SPDRs is with CandleGlance charts sorted by the Rate-of-Change indicator to rank performance. This is a great way to quickly separate the leaders from the laggards and analyze short-term price action... Read More
ChartWatchers October 19, 2018 at 02:35 PM
Editor's Note: This article was originally published in John Murphy's Market Message on Thursday, October 18th at 5:00pm ET... Read More
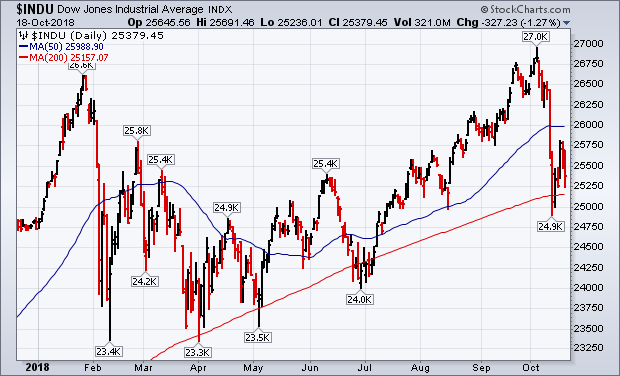
ChartWatchers October 19, 2018 at 02:26 PM
The market has been under fire for the past two weeks. Volatility has spiked. Traders have bailed as they've sold on rallies. Bad news is bad news. Good news is bad news... Read More
ChartWatchers October 06, 2018 at 03:36 PM
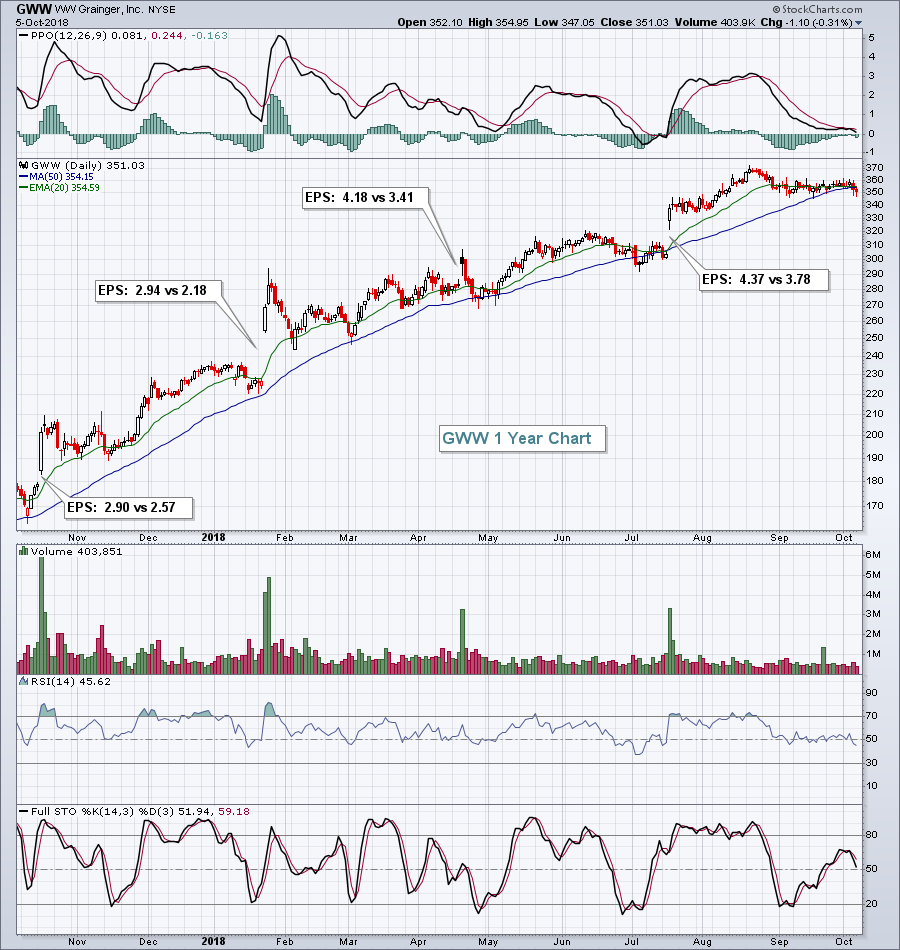
We're approaching another earnings season, setting up trading opportunities in the normally bullish fourth quarter... Read More
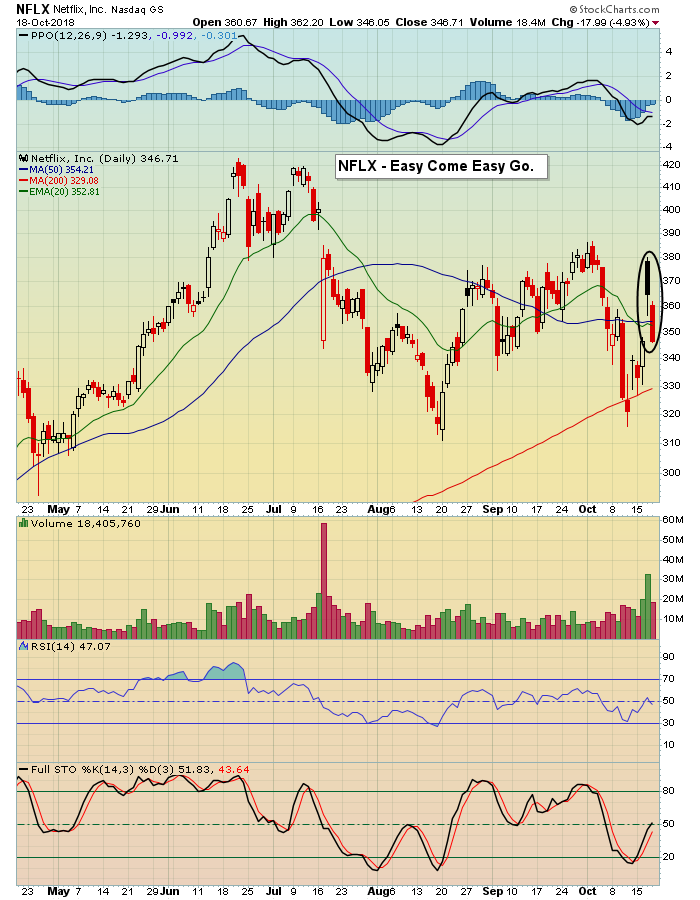
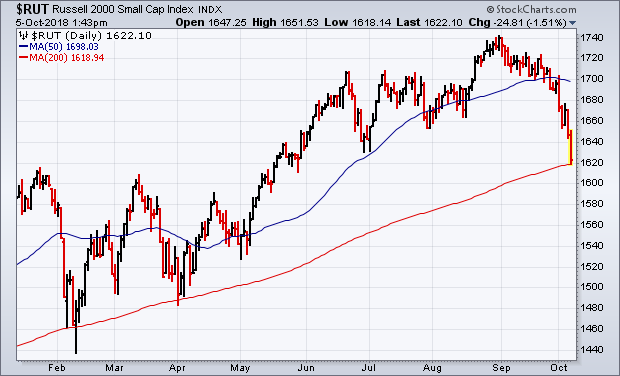
ChartWatchers October 06, 2018 at 01:59 PM
It was a brutal week for many areas of the stock market, but mostly those areas that have led the charge for so long. Stocks that for one to two years or more rarely saw a significant pullback suddenly couldn't find buyers this week. Unfortunately, that's how Wall Street works... Read More
ChartWatchers October 06, 2018 at 11:00 AM
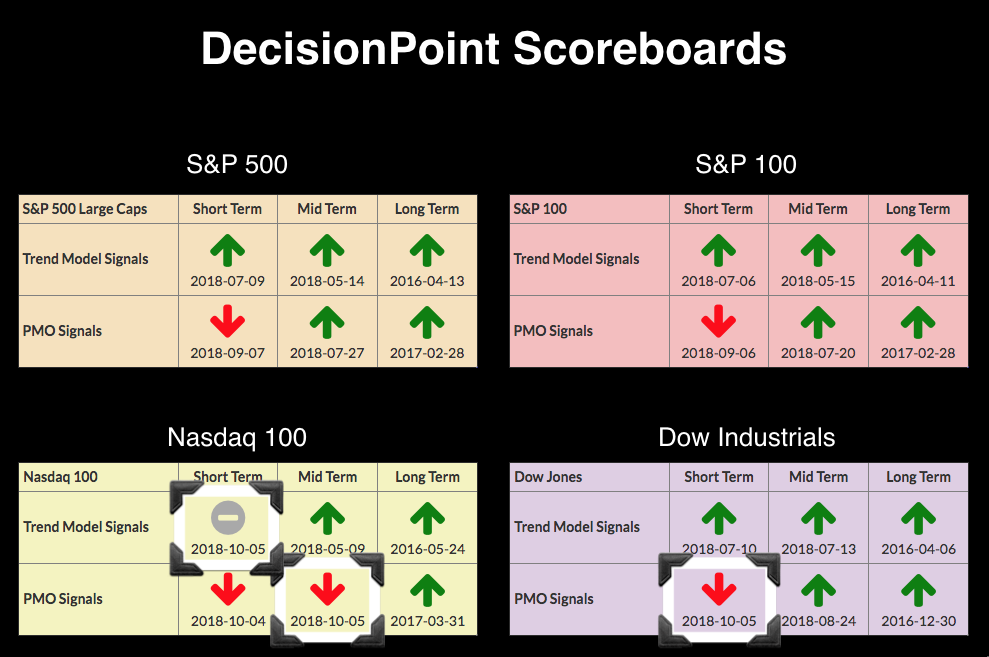
The BUY signals are starting to peel away on the DecisionPoint Scoreboards. The Dow which has been the most stout, but after the corrective move of the past two days, it couldn't hang on to its "all green" Scoreboard... Read More
ChartWatchers October 06, 2018 at 10:59 AM
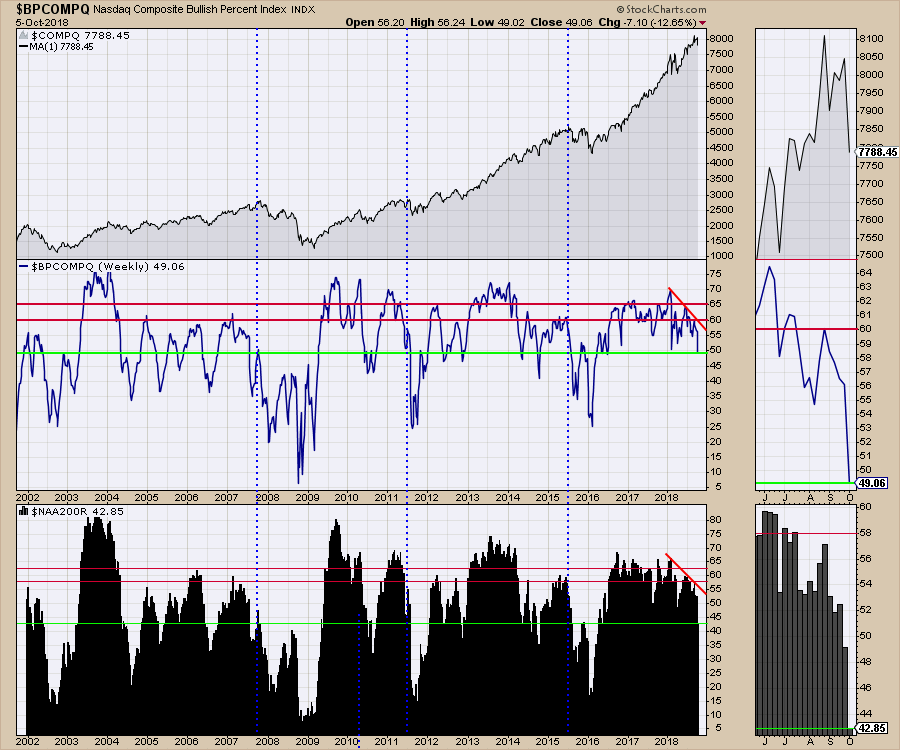
Before heading off on my vacation, I mentioned the breadth indicators for the major exchanges were getting weak, but the breadth for the $SPX was still very bullish. This week the main exchanges saw the breadth crash to twenty-four month lows... Read More
ChartWatchers October 06, 2018 at 10:30 AM

Utilities are not the most exciting stocks in the world, but the Utilities SPDR (XLU) is the third best performing sector since February and the second best performing sector last week. The could have further to run. Let's look at the charts... Read More
ChartWatchers October 06, 2018 at 09:53 AM
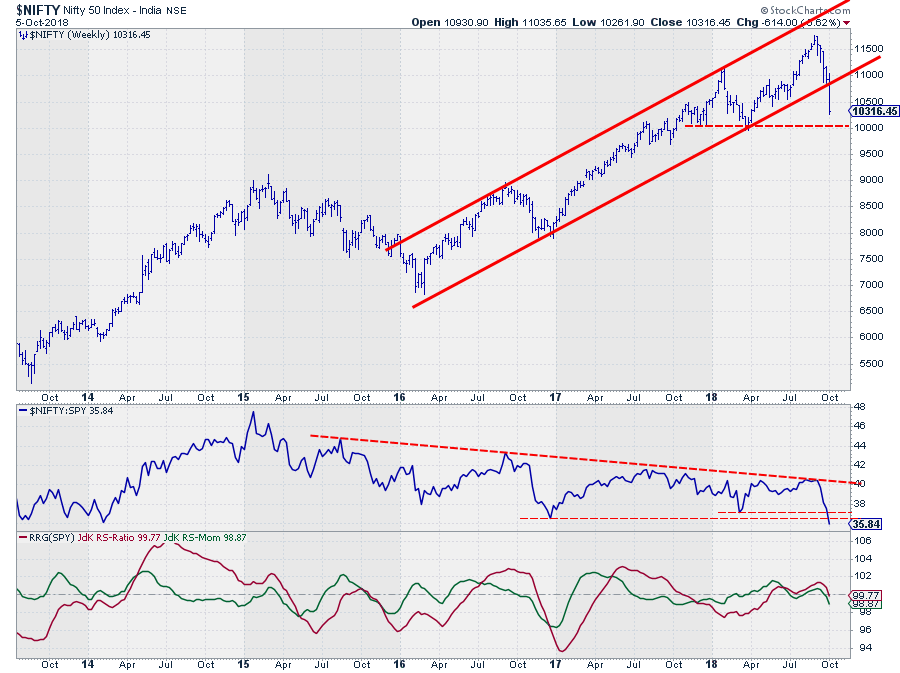
The Indian $NIFTY Index dropped out of an almost three-year uptrend at the close of last week. The rising support line that started at the low in early 2016 did not manage to hold up and was clearly broken during last week's market action... Read More
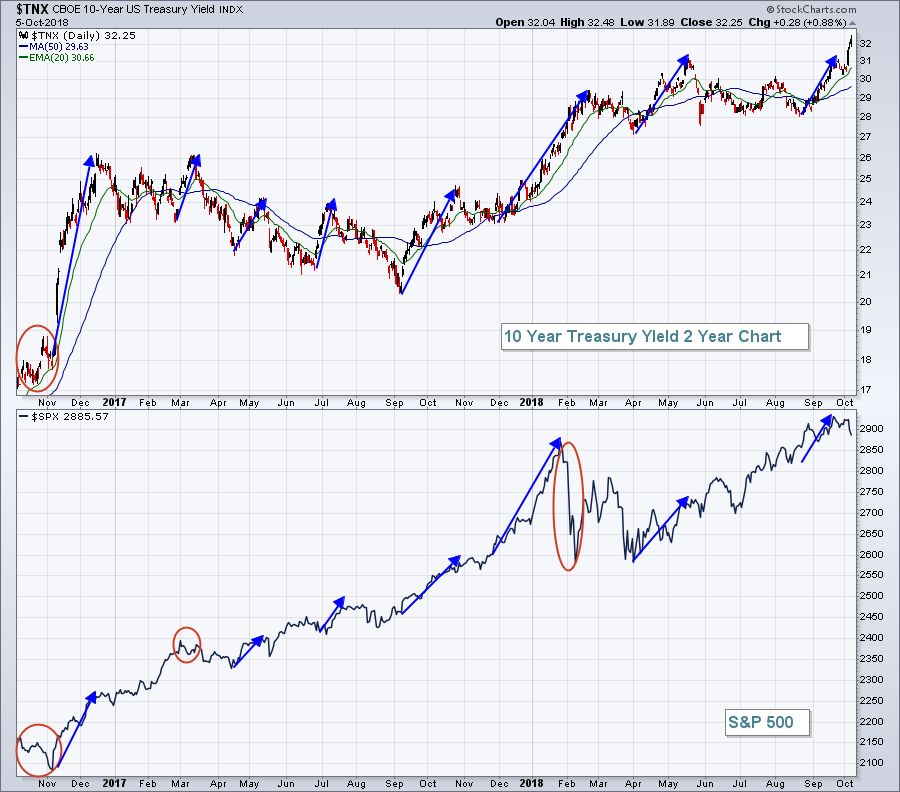
ChartWatchers October 05, 2018 at 01:35 PM
Editor's Note: This article was originally published in John Murphy's Market Message on Friday, October 5th at 2:02pm ET... Read More