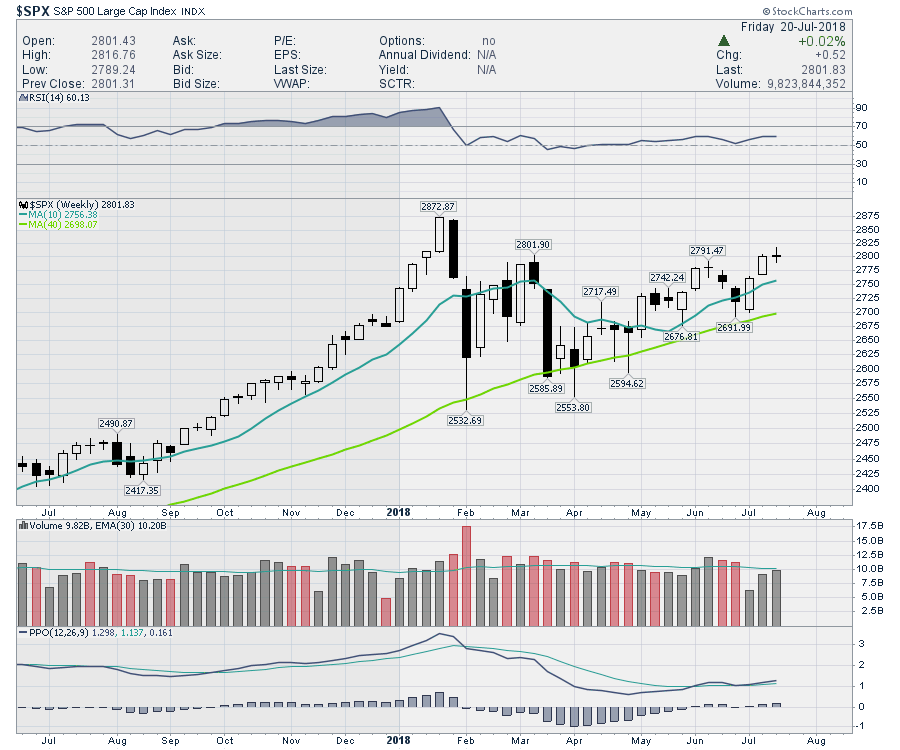
The US earnings season is in full bloom with major corporate earnings announcements flowing. The earnings have come out just fine, but it seems investors had already figured that out. This week the market is flat with a doji candle. What brings this doji to my attention is that it showed up while we were trying to make a convincing break above 2800.
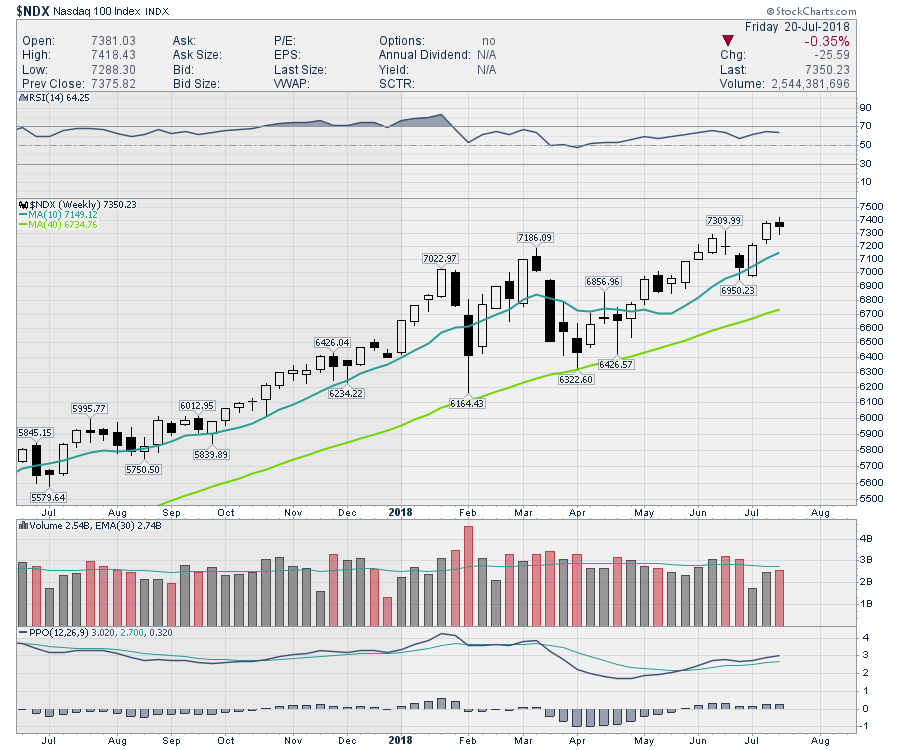
There has been a lot of talk about the FANG leadership and the heavy weighting they have on the index. The bottom line is the NASDAQ 100 ended the week with a slight negative which is hardly the resounding push we need to improve the momentum of the market. Microsoft had great earnings. The next few weeks will bring out more of the tech heavyweights.
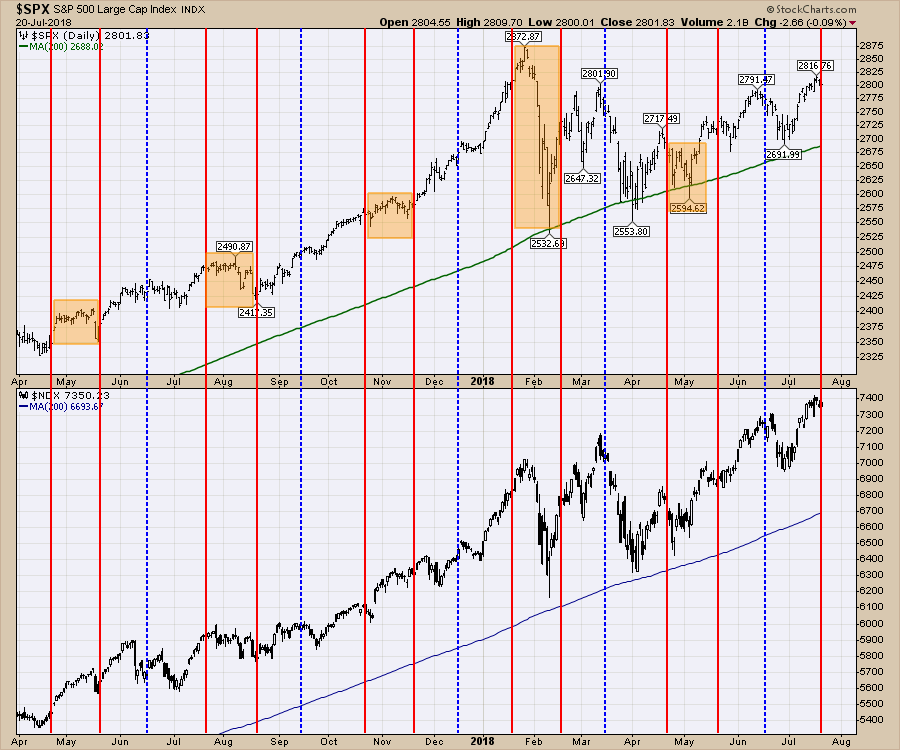
 While its too early to say the $SPX index will top out at this 2800 level again, it is an important time to stay focused as the PPO is currently just above the signal line. The big tech names will really need to improve the market momentum. The chart below highlights the options expiration dates. The blue lines represent quadruple options expirations. Shaded areas show what has happened after the last 5 options expirations during earnings season. The market behavior has been flat or down. We'll have to see if this earnings period can break the current trend.
Below is the Commodities Countdown video that walks through the decimation going on in a lot of the commodities right now.
The Final Bar recording for Thursday July 19th contains information on the fresh breakout in the $USD. I cover off bonds as well. All of these markets are at very critical technical locations. If the USD is going to soar and create a bunch of trend changes on the other charts, you'll want to see the setups in advance. That is what the video covers off.
This week's Canadian Technician video discusses a lot of the sectors and specifically reviews the technology sector stocks.
If you are missing intermarket signals in the market, follow me on Twitter and check out my Vimeo Channel often. Bookmark it for easy access!
Good trading,
Greg Schnell, CMT, MFTA
Senior Technical Analyst, StockCharts.com
Author, Stock Charts for Dummies
Want to read more from Greg? Be sure to follow his two StockCharts blogs:
Commodities Countdown and The Canadian Technician