ChartWatchers September 17, 2016 at 10:51 PM
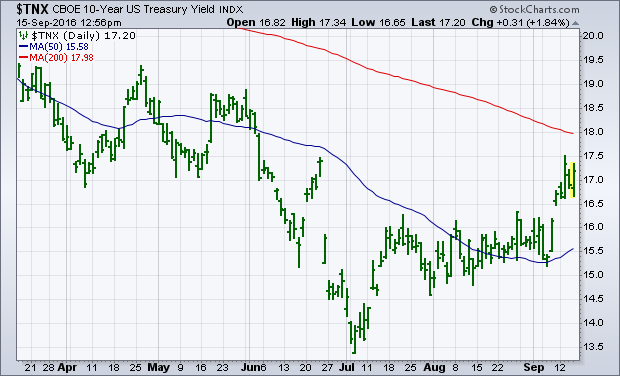
I've been writing about the upturn in global bond yields, which has boosted Treasury bond yields. Chart 1 shows the 10-Year Treasury Yield trading above 1.70% in today's trading. Foreign yields are bouncing as well... Read More
ChartWatchers September 17, 2016 at 10:40 PM
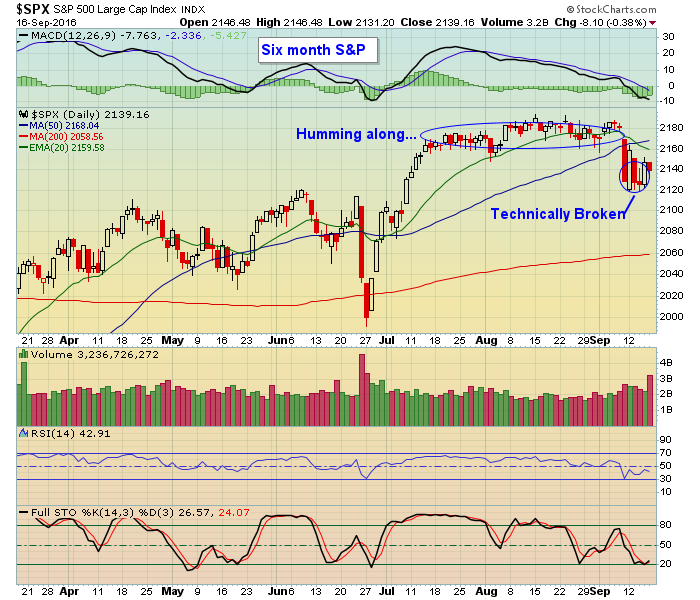
September has a reputation of being a difficult month for traders. So far it is living up to its reputation. The S&P started out the month pretty much like it had the prior many weeks; going nowhere... Read More
ChartWatchers September 17, 2016 at 06:00 PM

Hello Fellow ChartWatchers! Markets are pulling back from their highs on increasing volume. You can see the weekly and daily charts with my annotations by clicking here. But even in this declining market environment, there are always possibilities... Read More
ChartWatchers September 17, 2016 at 03:49 PM
This is the final ChartWatchers newsletter before all of us here at StockCharts.com descend upon Northern California to produce what I believe will be one of the most educational online financial conferences of our time... Read More
ChartWatchers September 17, 2016 at 01:00 PM
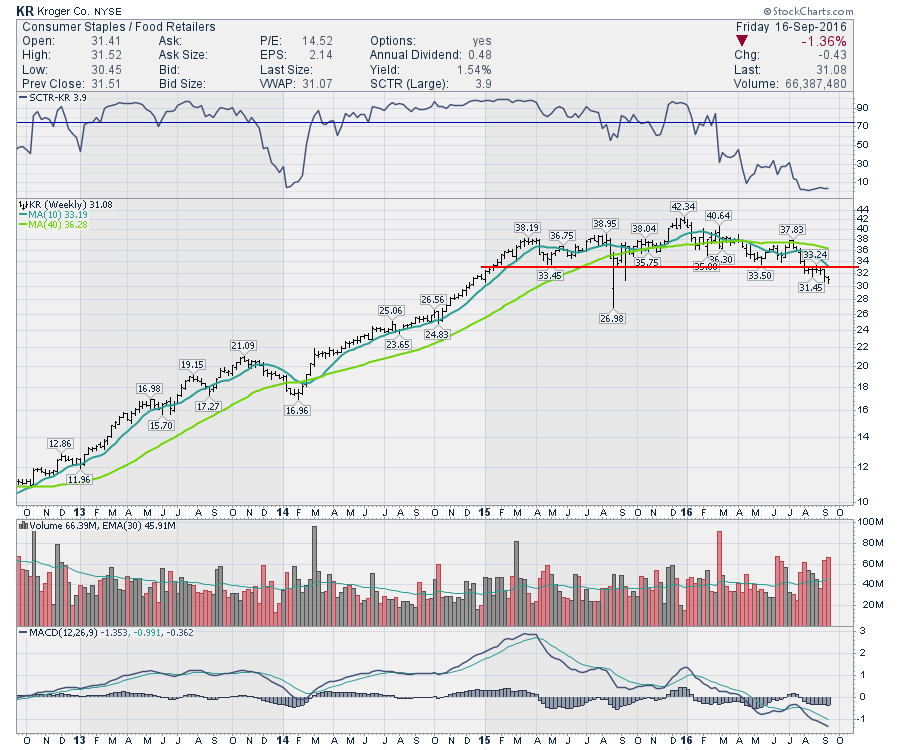
The Grocery chains are usually a free cash flow machine and are in the Consumer Staples Group. Walmart is an exception sitting in the Consumer Cyclicals group. Walmart started as a Broadline Retailer and added groceries... Read More
ChartWatchers September 17, 2016 at 09:50 AM
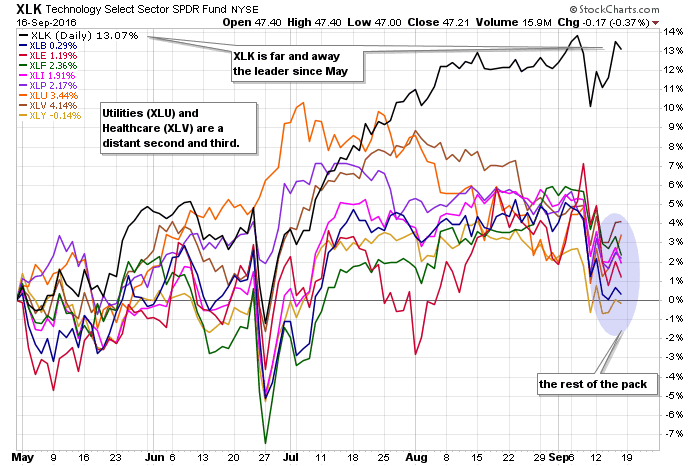
There is the tech sector, and then there is the rest of the stock market. It is not that bad, but the tech sector is clearly head and shoulders above the other sectors. This is true with the Technology SPDR (XLK) and the EW Technology ETF (RYT)... Read More
ChartWatchers September 16, 2016 at 09:13 PM
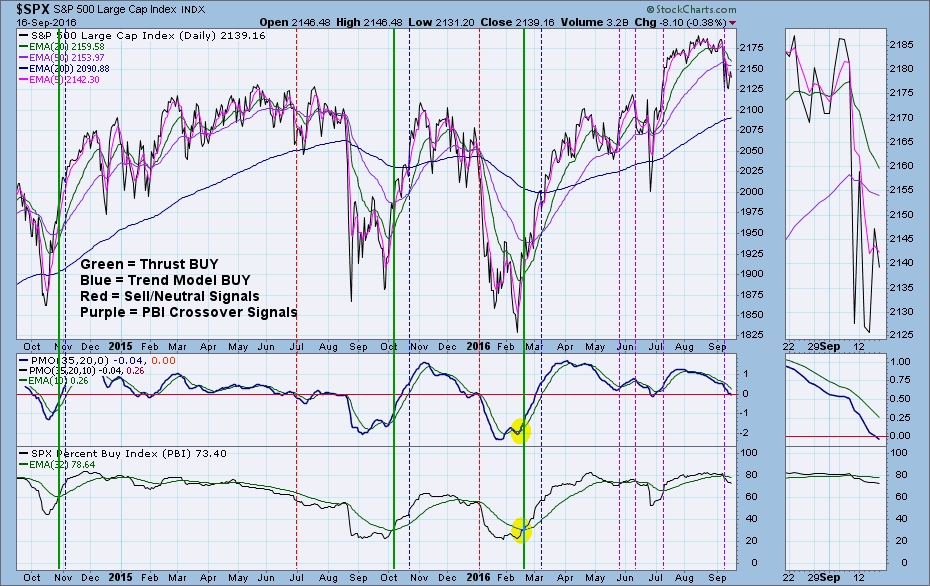
A comment on a recent DecisionPoint Alert blog article prompted me to review the Thrust/Trend Model indicator chart. During Friday's webinar I brushed over it as time was quickly disappearing. I promised to go over it in more detail in my ChartWatchers article... Read More
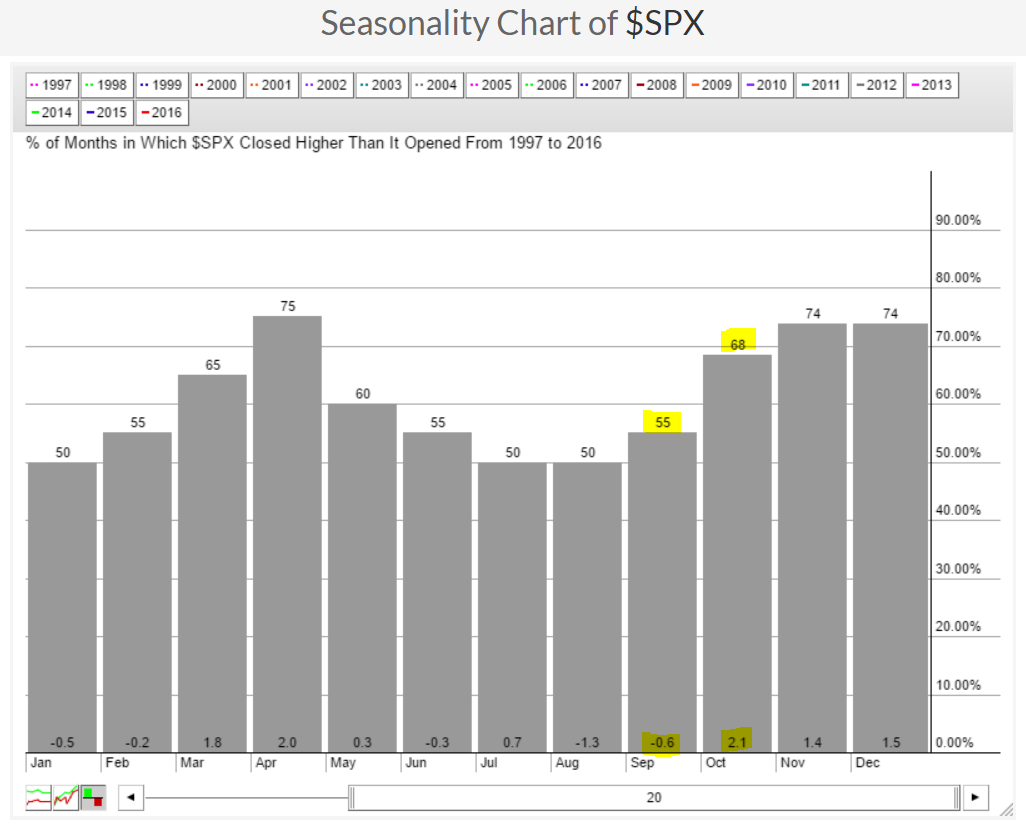
ChartWatchers September 03, 2016 at 07:19 PM
The market has been in consolidation mode for over six weeks now. The S&P closed at 2173 on July 20. It closed at 2179 on Friday... Read More
ChartWatchers September 03, 2016 at 07:14 PM
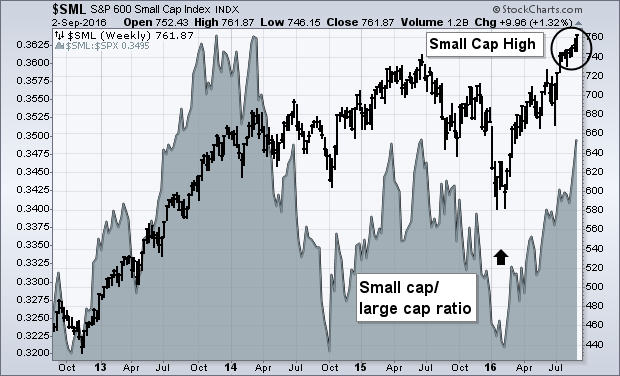
While most of the media focus is on sideways action in large cap stocks, smaller stocks have been rising. The weekly bars in Chart 1 show the S&P 600 Small Cap Index ($SML) ending the week at a new record high... Read More
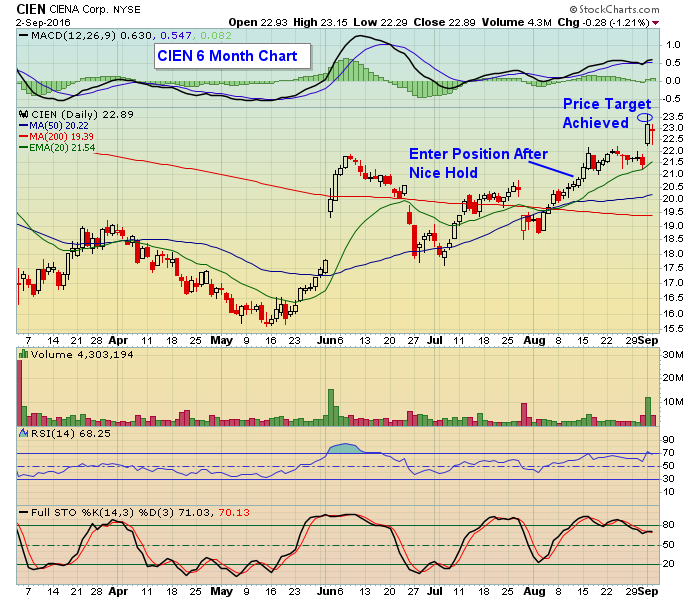
ChartWatchers September 03, 2016 at 06:10 PM

Hello Fellow ChartWatchers! The markets continue to move sideways causing trend and momentum indicators to gradually lose their usefulness... Read More
ChartWatchers September 03, 2016 at 12:43 PM
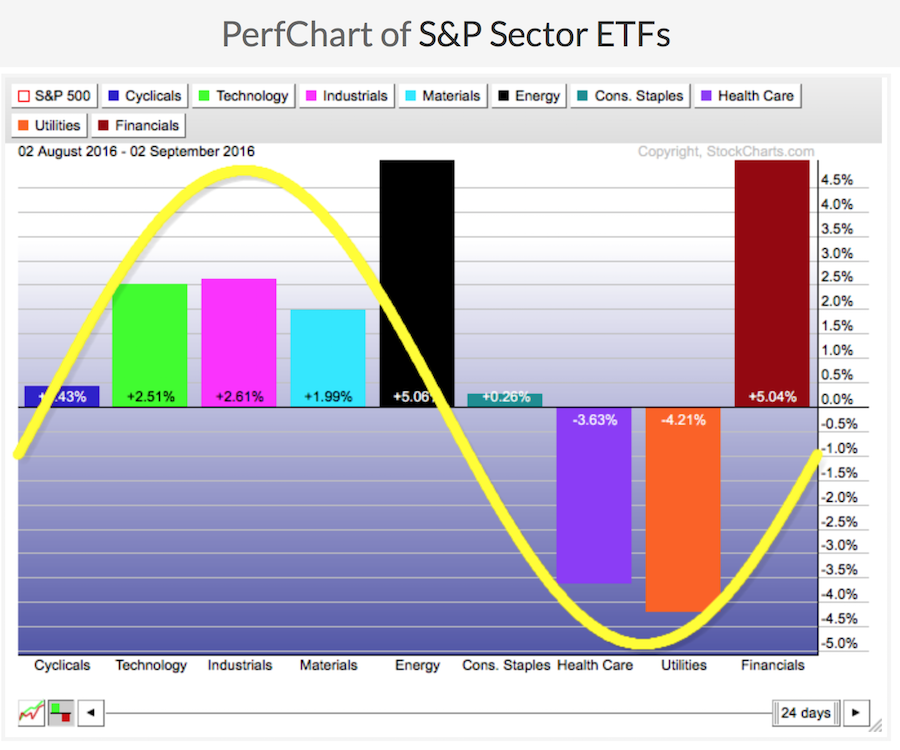
I am not sure if everyone is watching how stellar the performance of the two particularly strong sectors in September has been. A look at the one-month performance shows a clear lean on Financials and Energy... Read More
ChartWatchers September 03, 2016 at 11:39 AM
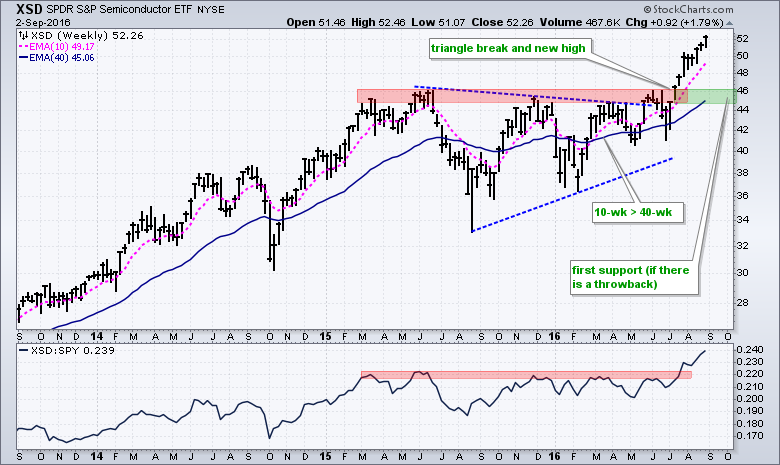
Semiconductors are leading the charge in tech stocks as the Semiconductor SPDR (XSD) extends its gains and notches another 52-week high this week. Note that the ETF is up around 15% the last three months and it is one of the top performing industry group ETFs... Read More
ChartWatchers September 03, 2016 at 10:52 AM
First, I'd like to invite everyone to join us via the internet for ChartCon 2016. It's only three weeks away and everyone here is growing very excited for this one-of-a-kind event. There will be tons of technically-oriented presentations from leading technical experts... Read More
ChartWatchers September 02, 2016 at 10:54 PM
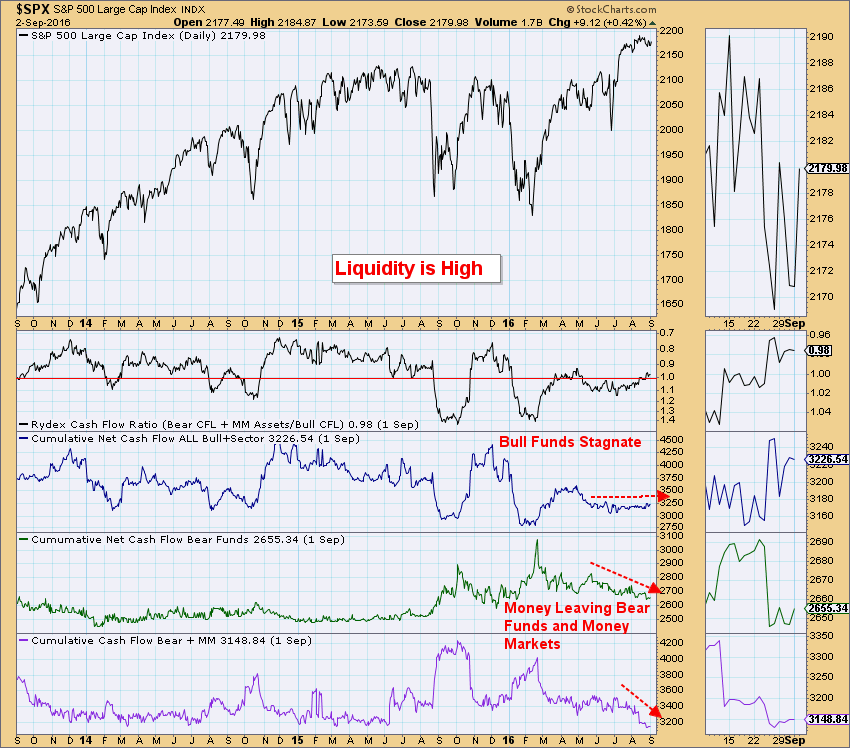
Liquidity can be equated to the availability of money. In terms of the market, when there is money on the sidelines, it is available for investing and could boost the market when/if it is invested... Read More