ChartWatchers October 31, 2014 at 05:32 PM
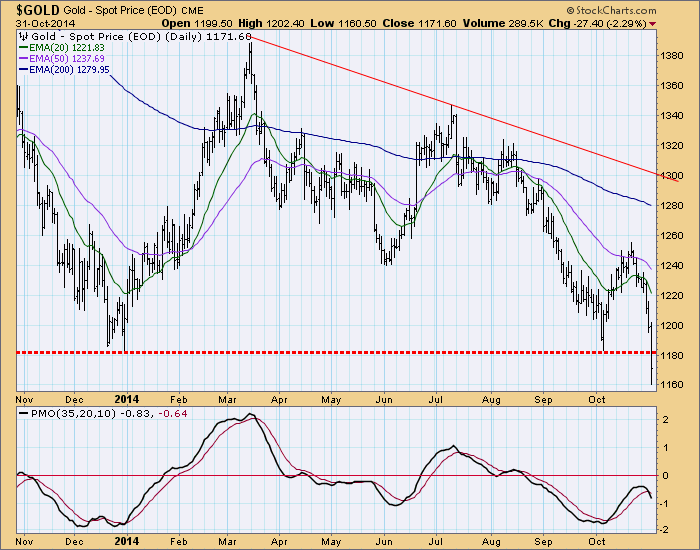
We have been watching gold for a possible triple bottom, a base for the next strong rally. Earlier this month gold bounced off an important support line, offering hope to gold bulls that the third bottom in the series would be successful... Read More
ChartWatchers October 19, 2014 at 12:40 AM
Hello Fellow ChartWatchers! Friday's rally changed last week's Dow candlestick from a big filled candle into more of a big Hammer (although not a perfect one). After Friday's rally, the Dow finished the week down 1% as did the S&P 500 Large Caps... Read More
ChartWatchers October 18, 2014 at 03:05 PM
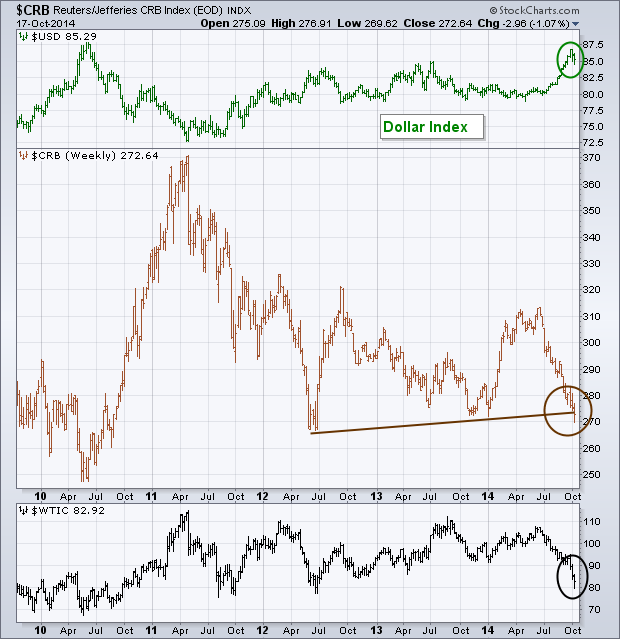
Today's message takes a look at commodity prices because they've been the focus of a lot of attention of late. That's because falling commodity prices are deflationary in nature, which is something central bankers are trying to stop... Read More
ChartWatchers October 18, 2014 at 02:58 PM
Make no mistake about it, volume has exploded and stock prices have fallen and lost key support levels. That combination is bearish in and of itself... Read More
ChartWatchers October 18, 2014 at 04:24 AM
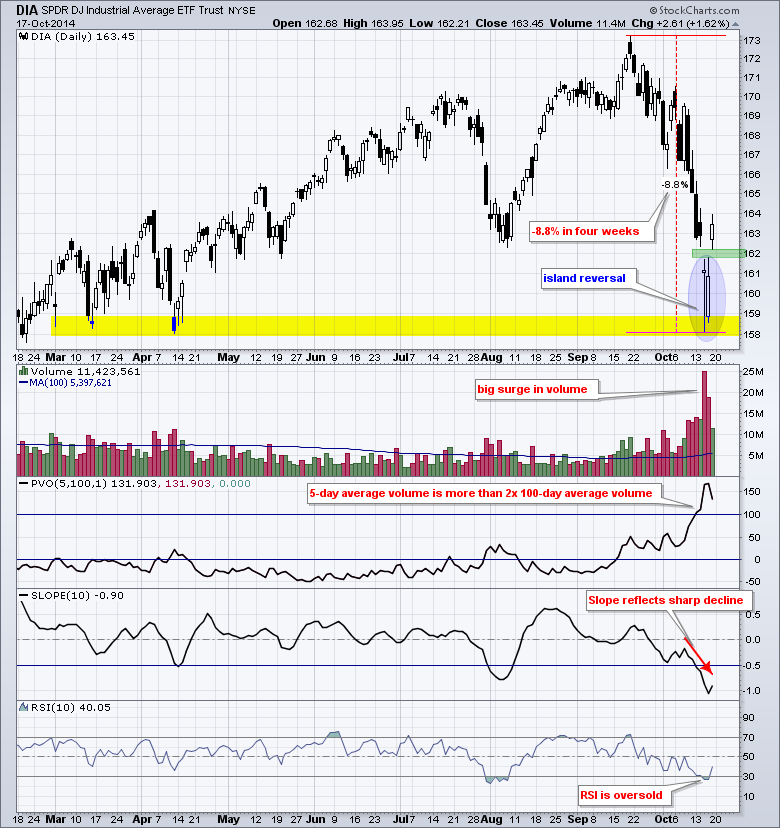
The Dow Diamonds (DIA) showed signs of a selling climax last week and forged an island reversal to end the week. First, let's look at the indicators to suggest that we had a selling climax or capitulation of sorts... Read More
ChartWatchers October 18, 2014 at 04:07 AM
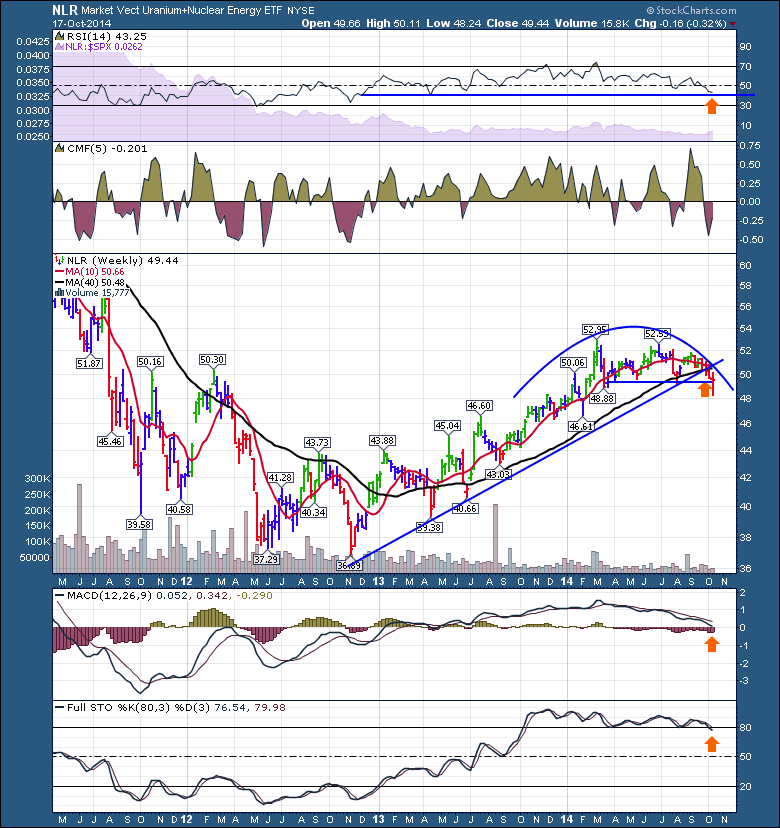
In this world of crosscurrents and 10% pullbacks, The Nuclear ETF (NLR) was no different. It has made about a 10% pullback off the highs. But unlike the S&P 500 ($SPX), the NLR made it's highs in March not September. So while this looks the same it feels different... Read More
ChartWatchers October 17, 2014 at 12:58 PM
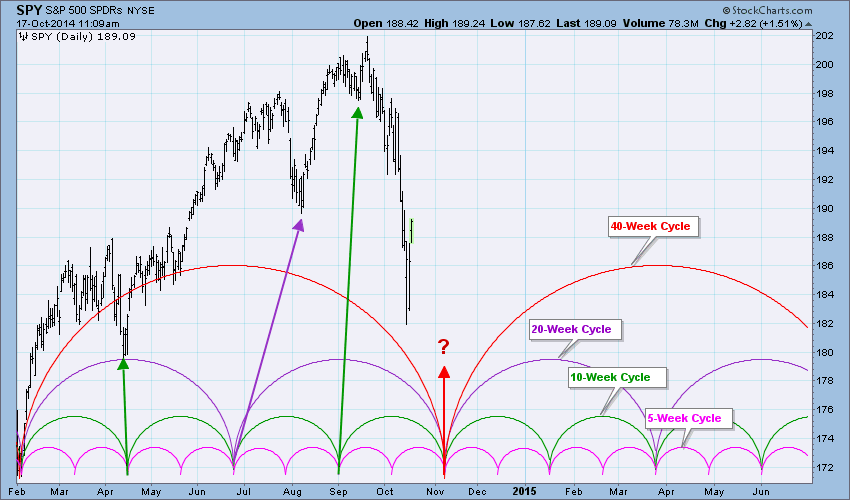
Fair warning! If you read this article and get hooked on cycle analysis, you will rue the day. If we look at price charts, we can clearly see that prices move up and down in cycles, but trying to use this tool can be frustrating beyond words... Read More
ChartWatchers October 04, 2014 at 06:36 PM
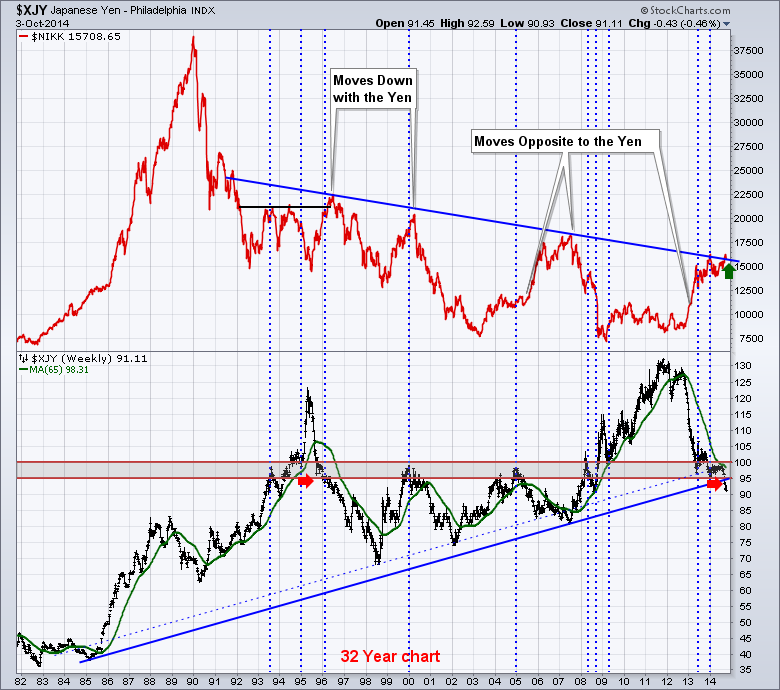
I have been very interested to watch the Japanese Equity Market ($NIKK) to see if it can hold the breakout from the 25 year trend line. First of all, here is a long chart. Why does this matter? When a long trend line breaks it is usually very important... Read More
ChartWatchers October 04, 2014 at 06:16 PM
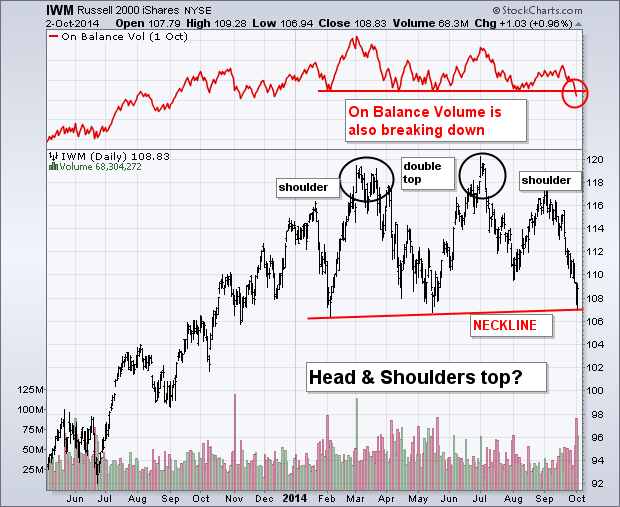
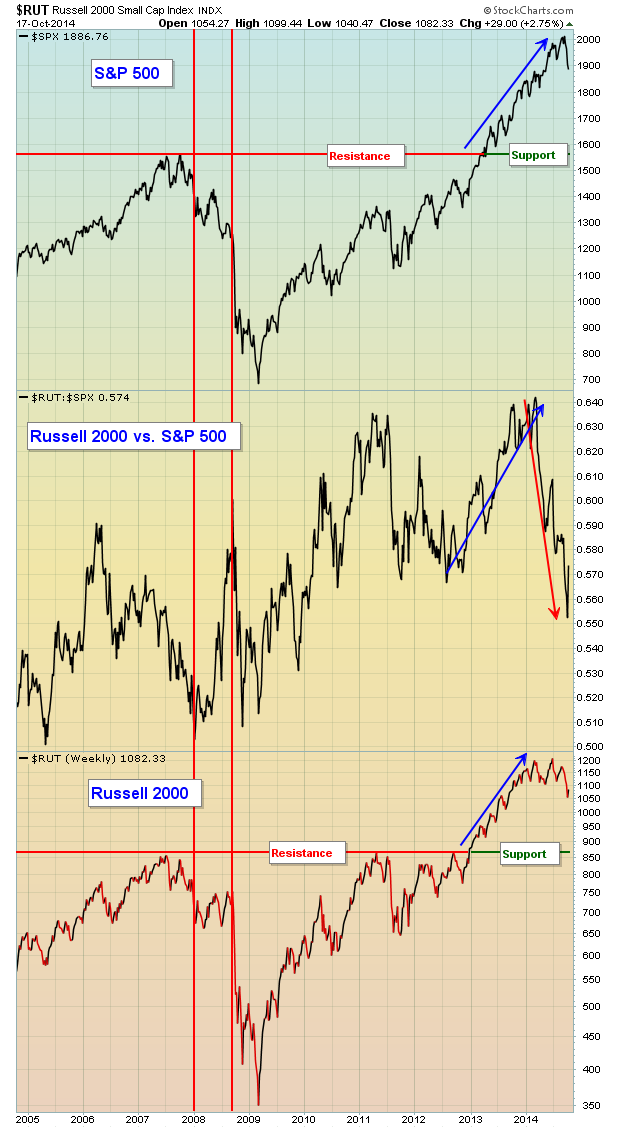
A debate is going on within the technical community as to whether or not the Russell 2000 Small Cap Index is in danger of completing a "head and shoulders top". A case can certainly made for it, although it would be an unusual one... Read More
ChartWatchers October 04, 2014 at 06:13 PM
The Fed is winding down its asset purchase program and the historically weak month of September is now behind us. So what's in store next? Earnings season... Read More
ChartWatchers October 04, 2014 at 06:06 PM
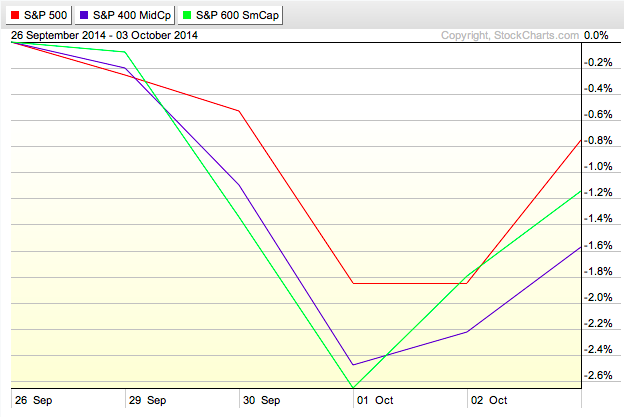
Hello Fellow ChartWatchers! It was definitely a roller coaster ride for stocks this week. The bears were firmly in control on Wednesday but then the Bulls roared back Friday on the strength of the US Employment numbers... Read More
ChartWatchers October 04, 2014 at 06:13 AM
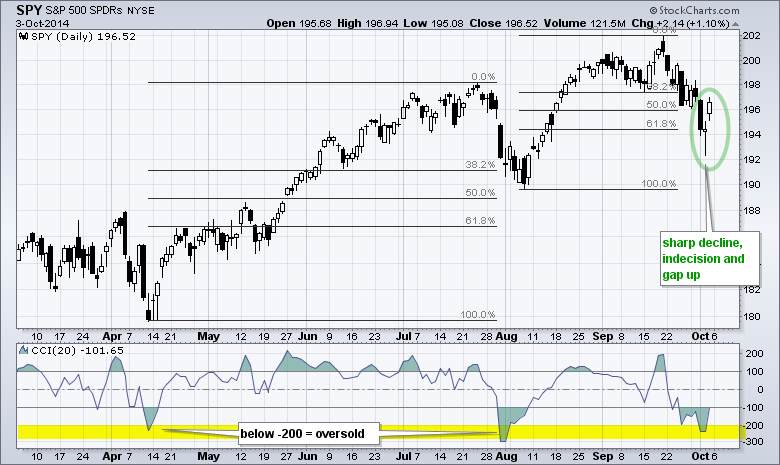
The S&P 500 SPDR (SPY) appears to be putting in another higher low that could signal the resumption of the long-term uptrend. First and foremost the long-term trend is up because SPY recorded a 52-week high less than three weeks ago... Read More