ChartWatchers June 22, 2014 at 09:17 AM
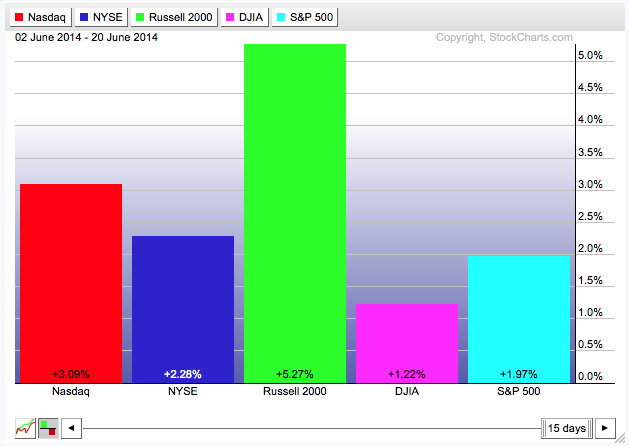
Hello Fellow ChartWatchers! Small Caps have been on a tear recently - have you noticed? This week all the major market averages moved higher with the Russell 2000 Small Caps (+1.85%) leading the way... Read More
ChartWatchers June 21, 2014 at 06:14 PM
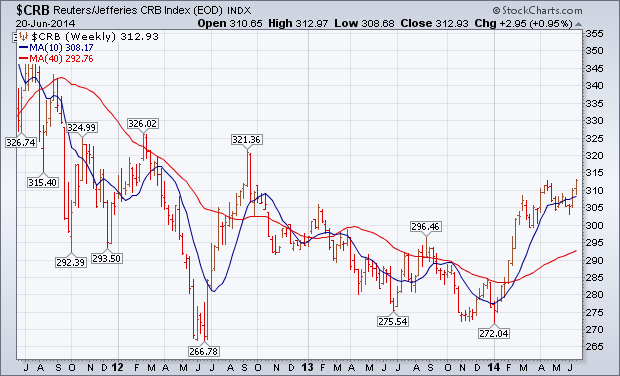
The weekly bars in Chart 1 show the Reuters/Jefferies CRB Index closing at the highest level since the third quarter of 2012. [The CRB Index includes 19 commodities that are traded on exchanges in the U.S. and U.K.]... Read More
ChartWatchers June 21, 2014 at 06:04 PM
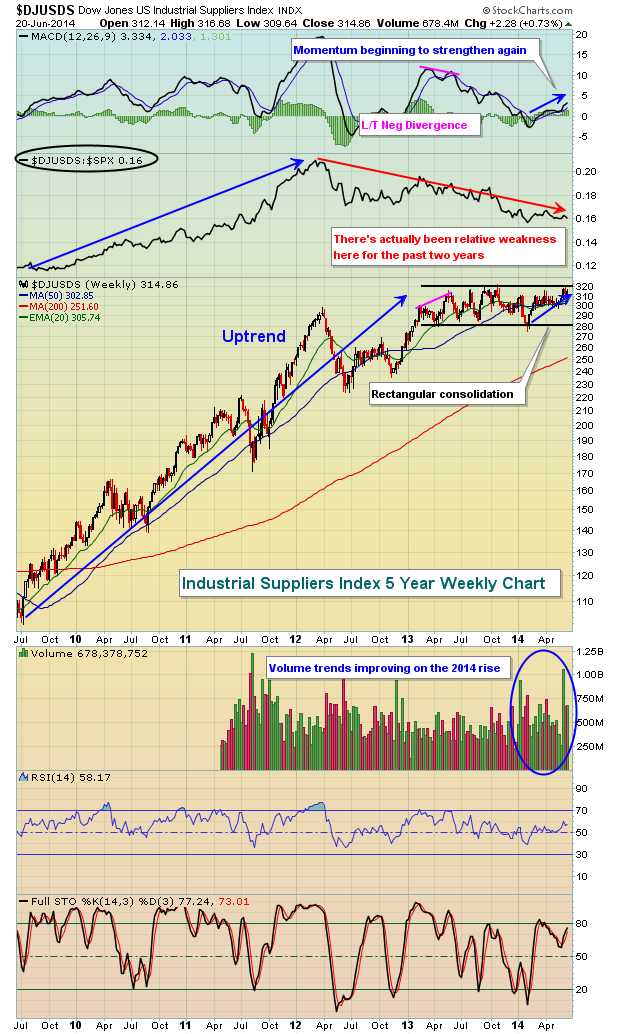
The Dow Jones US Industrial Suppliers Index ($DJUSDS) experienced a HUGE bull market run off the 2009 lows through mid-2013, quadrupling in value during the period. Momentum on the weekly chart turned negative, as evidenced by the long-term negative divergence on its MACD... Read More
ChartWatchers June 21, 2014 at 05:06 AM
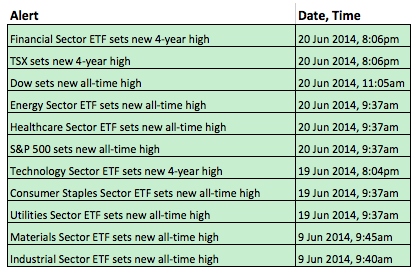
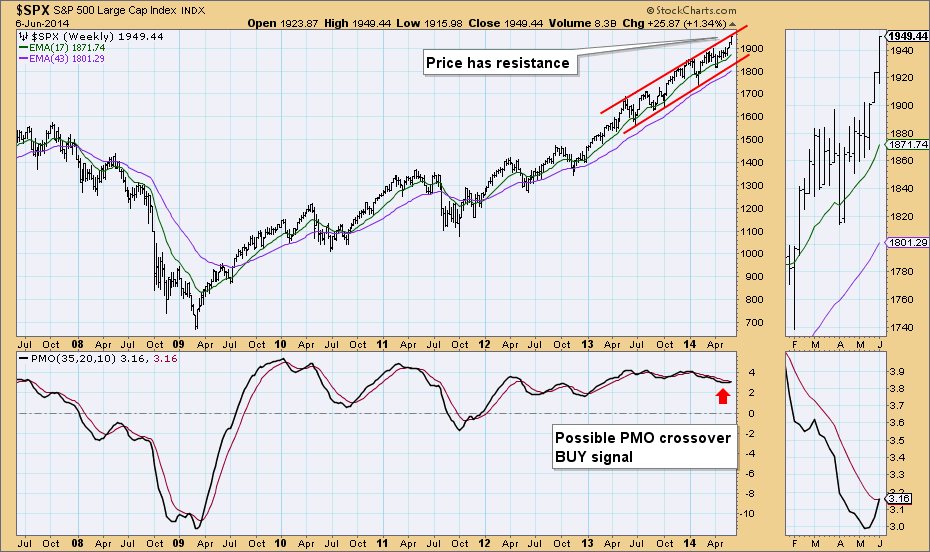
The overall picture remains bullish for stocks and sector participation is broad. Six of the nine sector SPDRs hit new highs this week, and seven of the nine hit new highs this month... Read More
ChartWatchers June 21, 2014 at 04:17 AM
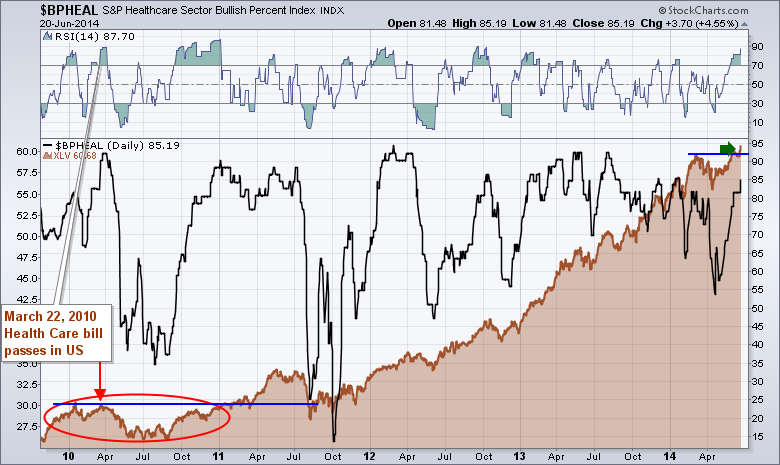
In reviewing my charts this weekend, I noticed that one of my annotations was about to slip off the charts. You can see it on the chart below. The Healthcare Bill passed over 4 years ago and it was about to scroll off my Healthcare Bullish Percent Index. ($BPHEAL)... Read More
ChartWatchers June 08, 2014 at 01:59 AM
Hello Fellow ChartWatchers! We are half-way through 2014 and so far it has been a positive year for stocks with the S&P up 5.5%, the Nasdaq up 3.5% and the Dow up 2.1%. Small-Caps haven't participated nearly as much as their larger counterparts however... Read More
ChartWatchers June 07, 2014 at 04:43 PM
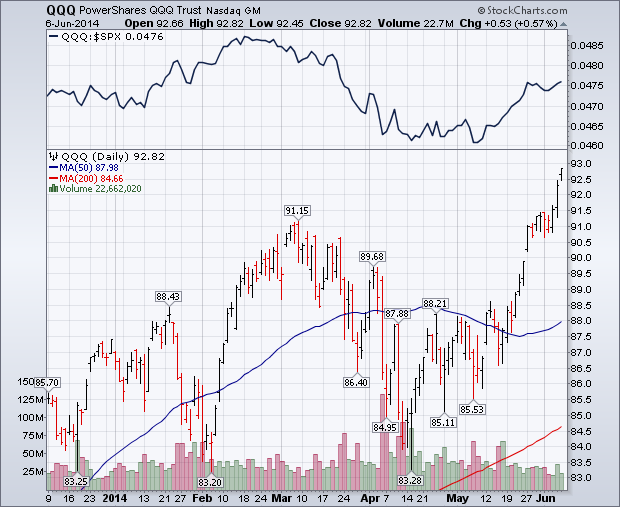
This week's strong chart action in the Nasdaq market and small caps has lent more support to large cap stock indexes that have been setting new record highs. Chart 1 shows Powershares QQQ Trust breaking out to a new recovery high this week... Read More
ChartWatchers June 07, 2014 at 04:30 PM
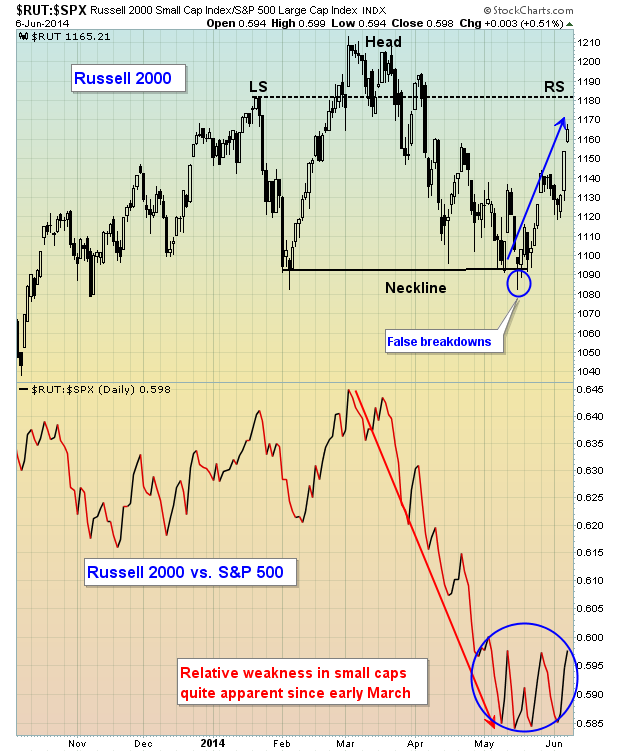
In my last article, I posted a chart of the Russell 2000, identifying a potentially bearish head & shoulders pattern. This pattern, however, requires a high volume breakdown to confirm the likelihood of future weakness... Read More
ChartWatchers June 07, 2014 at 02:16 PM
In many cases, we all spend a lot of time looking at daily charts and varying indicators. The Price Momentum Oscillator (PMO) using daily, weekly and monthly data to create a unique value for the chart you're looking at... Read More
ChartWatchers June 07, 2014 at 09:09 AM
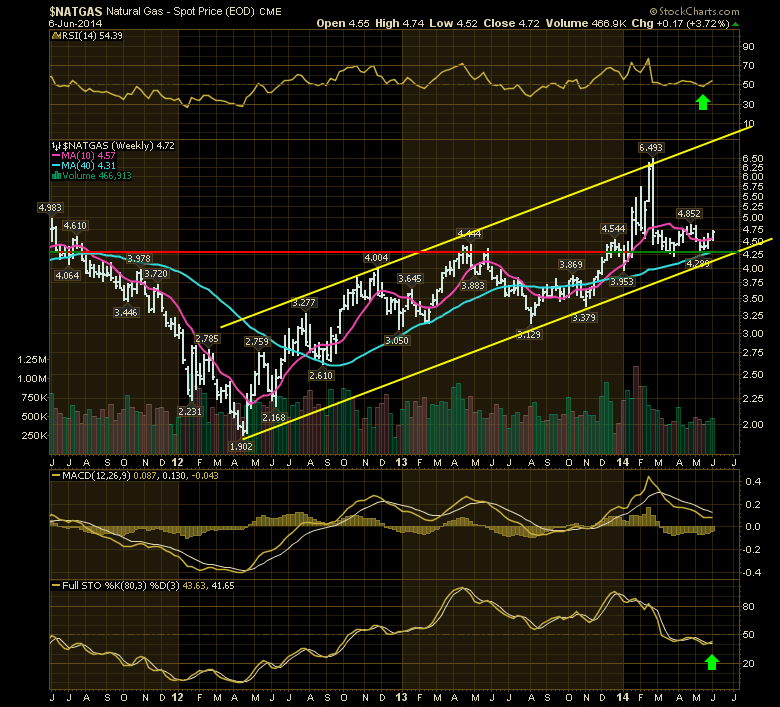
Natural Gas ($NATGAS) has been moving higher every week for three weeks now. As we head into the cooling season for air conditioning, it might be timely to stay in tune with the producers of Natural Gas. A few things make this particular turn compelling... Read More
ChartWatchers June 07, 2014 at 05:01 AM
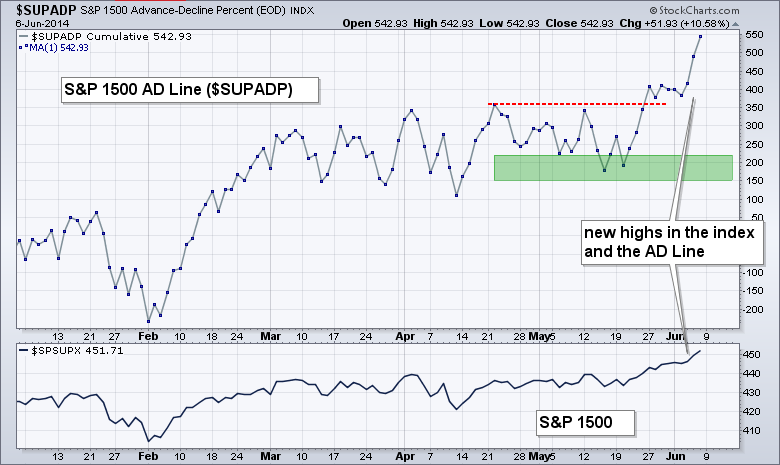
The AD Line and AD Volume Line are aggregate measures of participation. The AD Line favors small and mid-caps because an advance equals +1 and a decline equals -1, regardless of market cap... Read More