ChartWatchers November 23, 2013 at 10:17 PM
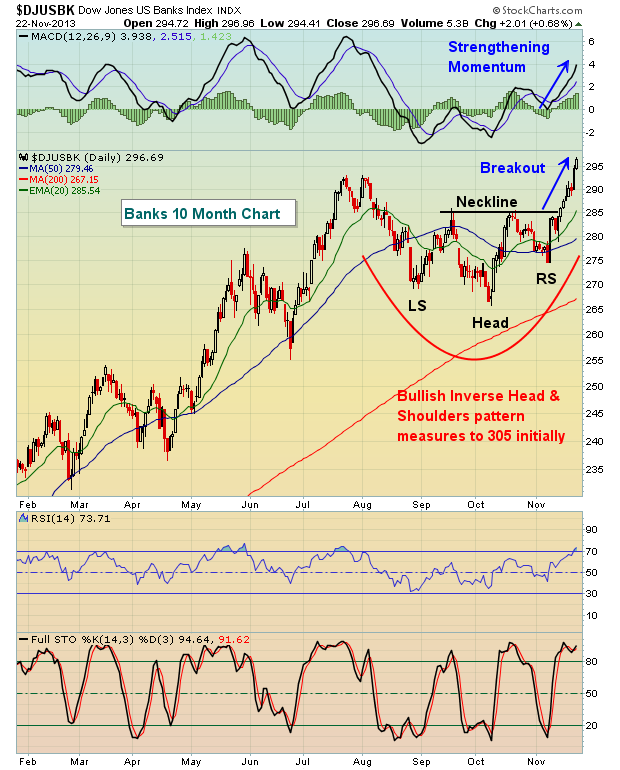
I rarely question a market move to the upside when banks are leading the charge... Read More
ChartWatchers November 23, 2013 at 10:08 PM
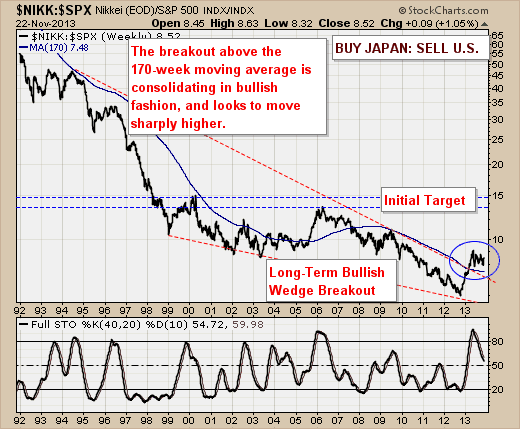
With the equity markets hitting all-time highs in many cases, we think it prudent to look around the world and determine if there are any better risk-reward countries into which one can invest or park money for the long-term... Read More
ChartWatchers November 23, 2013 at 09:59 PM
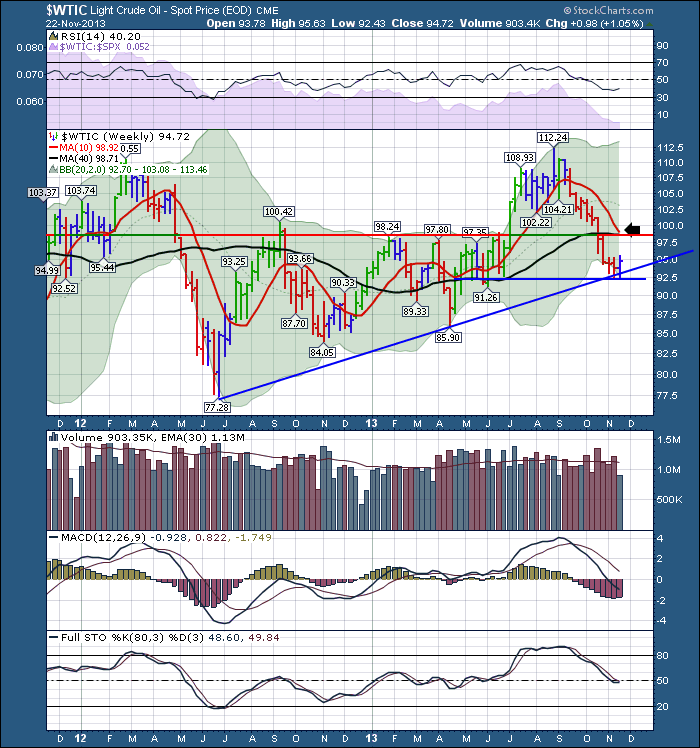
Crude oil has had a huge setback. It has fallen below all of the common moving averages. Is it ready for a bounce? Here is why I think it will retest the $100 level soon. For the live link to the chart. $WTIC Notice the uptrend line on crude oil off the 2012 lows... Read More
ChartWatchers November 23, 2013 at 09:48 PM
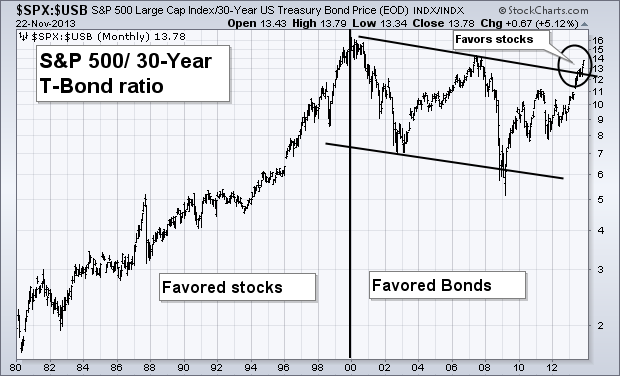
There's a positive side effect to rising bond yields. When bond yields rise, bond prices fall. When bond prices fall, investors start moving money into stocks. That sequence supports the view that higher bond yields are already causing a generational shift in favor of stocks... Read More
ChartWatchers November 23, 2013 at 06:00 PM
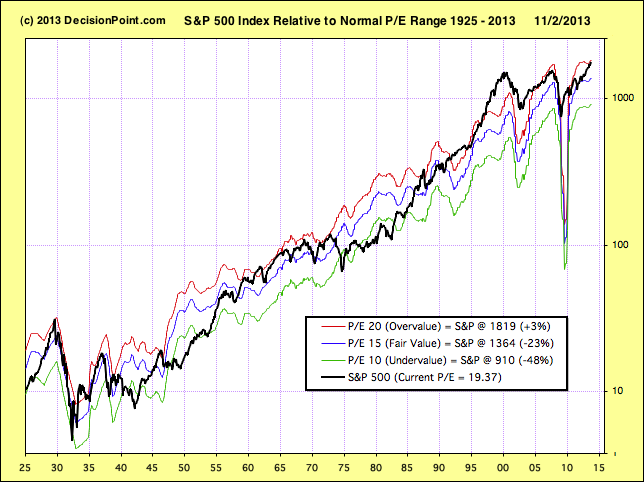
As usual we are hearing many claims regarding market valuation, mostly that stocks are undervalued based upon future earnings projections. We are also seeing a lot of headlines about stocks being in a bubble... Read More
ChartWatchers November 23, 2013 at 12:56 PM
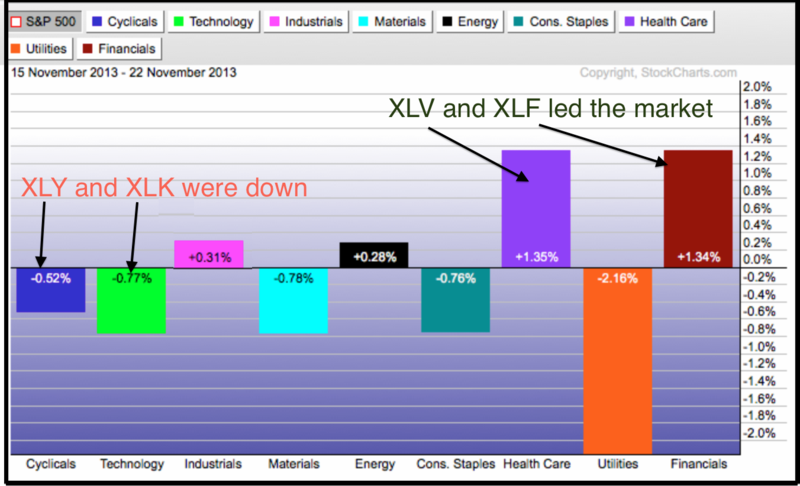
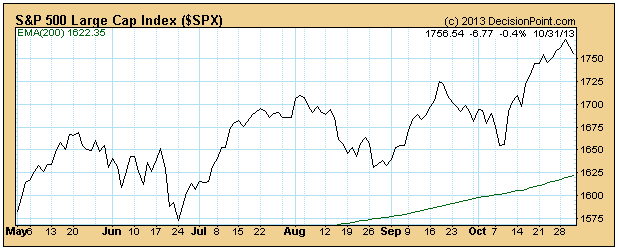
Hello Fellow ChartWatchers! Almost everything is at record highs right now. Dow is above 16,000. S&P is above 1800. All of the S&P Sectors are higher year-to-date with Health Care being the strongest (+40.3%) and Utilities being the weakest (+13.9%)... Read More
ChartWatchers November 23, 2013 at 04:52 AM
Three of the nine sector SPDRs hit new highs this week with the Finance SPDR (XLF) leading the way. The Energy SPDR (XLE) and the Healthcare SPDR (XLV) also recorded new highs... Read More
ChartWatchers November 16, 2013 at 03:04 PM
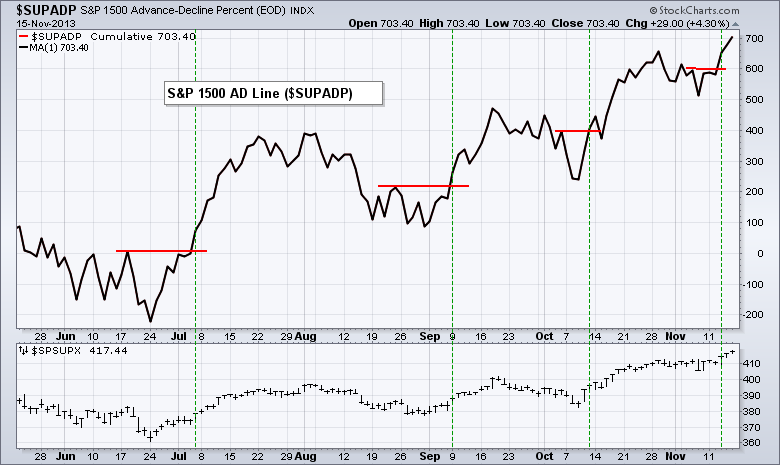
When a major index records a new high, I go straight to the key breadth indicators to see if these highs were confirmed. Breadth indicators are sometimes called "internal" indicators because they measure what is happening inside a specific index or ETF... Read More
ChartWatchers November 02, 2013 at 08:28 PM
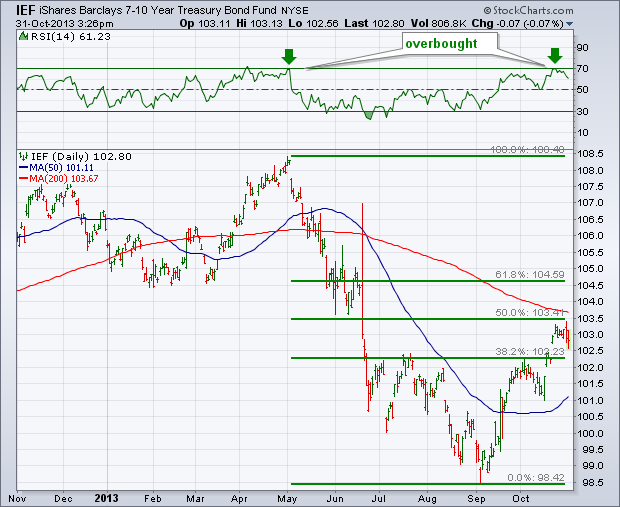
After selling off sharply between May and September, bond prices have been bouncing for the last two months. The bounce, however, has reached technical levels that may cap the rally. Chart 1 shows the 7-10 Year T Bond iShares (IEF) having retraced 50% of its previous downtrend... Read More
ChartWatchers November 02, 2013 at 08:25 PM
Research published by Yale Hirsch in the Trader's Almanac shows that the market year is broken into two six-month seasonality periods. From May 1 through October 31 is seasonally unfavorable, and the market most often finishes lower than it was at the beginning of the period... Read More
ChartWatchers November 02, 2013 at 08:22 PM
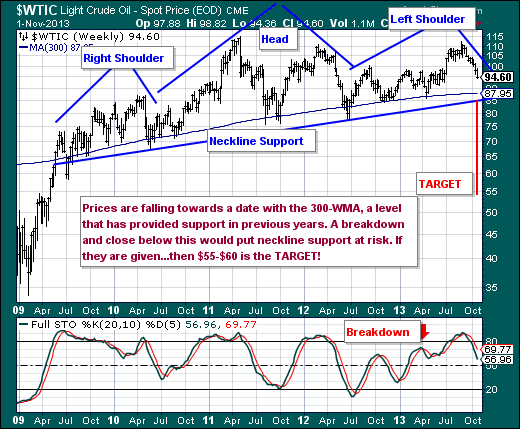
For the past 9-weeks, Crude Oil has weakened from $112/barrel to below $95/barrel. This is a rather sharp drop indeed, but the fact of the matter is that the fundamentals are bearish Crude Oil, and so is the techncial state of prices... Read More
ChartWatchers November 02, 2013 at 08:20 PM
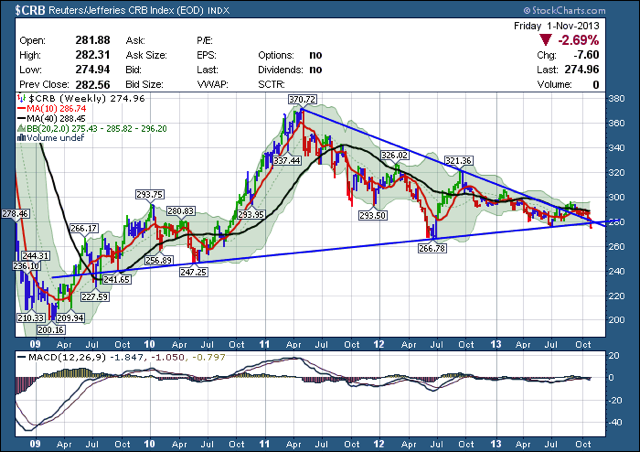
This week had bearish overtures for my view of the markets. Probably the one I worry about the most is the commodities Index, the $CRB. The break below the 5 year trend line is particularly disconcerting. One week does not make a new trend, but one week can start a trend... Read More
ChartWatchers November 02, 2013 at 08:14 PM

I've maintained a bullish stance throughout this bull market, but I have to admit I'm beginning to get a little nervous... Read More
ChartWatchers November 02, 2013 at 03:32 PM
Hello Fellow ChartWatchers! October didn't live up to its fearsome repution this year. The major averages were all up somewhere between 2 and 4% for the month with the exception of the Russell 2000 (which was up only 0.7%)... Read More
ChartWatchers November 02, 2013 at 02:03 PM
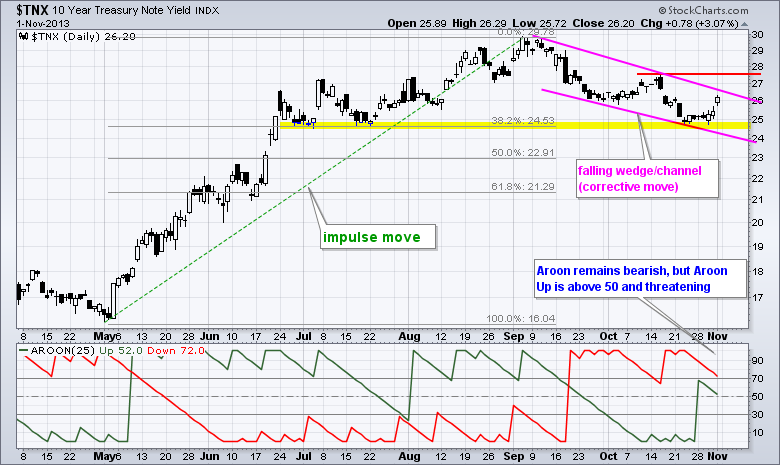
Basic Elliott wave teaches us that there are two types of price movements: impulse and corrective. Similarly, Dow Theory teaches us that there are primary price movements and secondary price movements. Impulse and primary moves are in the direction of the bigger trend... Read More