ChartWatchers October 15, 2011 at 09:13 PM
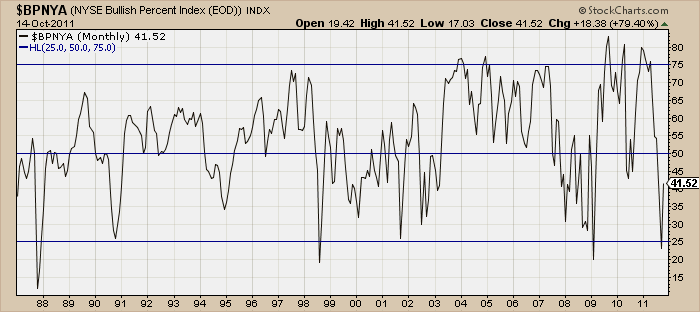
Hello Fellow ChartWatchers! "Distance not only gives nostalgia, but perspective, and maybe objectivity." - Robert Mogan Perspective... Read More
ChartWatchers October 15, 2011 at 06:00 PM
Last Thursday I showed some traditional charts that suggested stocks and commodities were due for a rally. In the case of stocks, a lot of global stock and U.S. stock indexes had reached important support at their mid-2010 lows and were in oversold territory... Read More
ChartWatchers October 15, 2011 at 05:58 PM
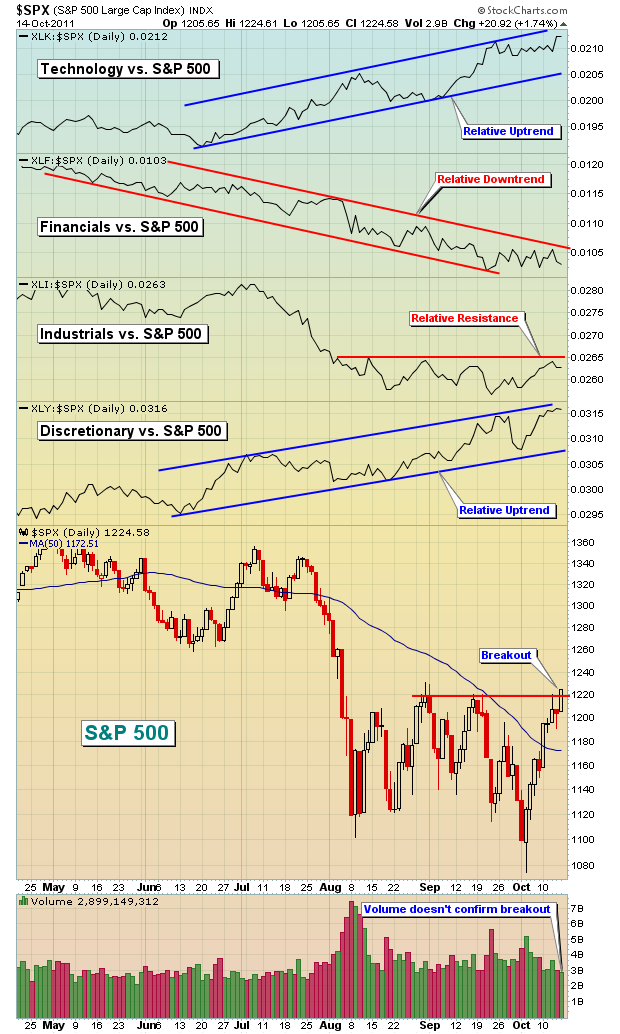
The market has spoken. If you're looking for nice earnings surprises for the third quarter, or perhaps raised guidance on a forward-looking basis, look no further than the technology and consumer discretionary sectors... Read More
ChartWatchers October 15, 2011 at 05:18 PM
DEALS, DEALS, DEALS - Here is a list of all the ways you can save money at StockCharts. Right now. No waiting. No hassel. Real money. Just do these things and start saving. Non-Members can subscribe to any of our charting services and get a 10-day free trial to test things out... Read More
ChartWatchers October 15, 2011 at 04:34 PM
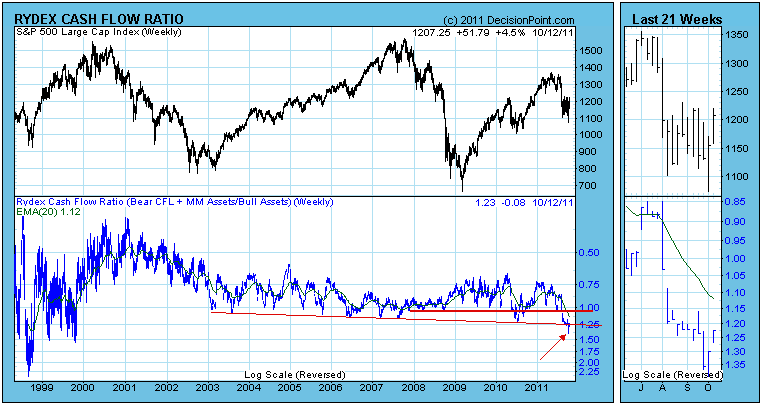
One of the ways we have of measuring sentiment is by tracking cash flow into and out of Rydex mutual funds through the use of our Rydex Cash Flow Ratio... Read More
ChartWatchers October 14, 2011 at 09:11 PM
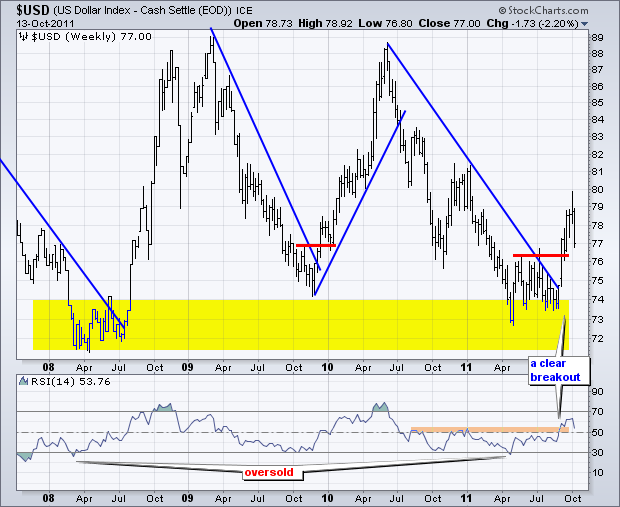
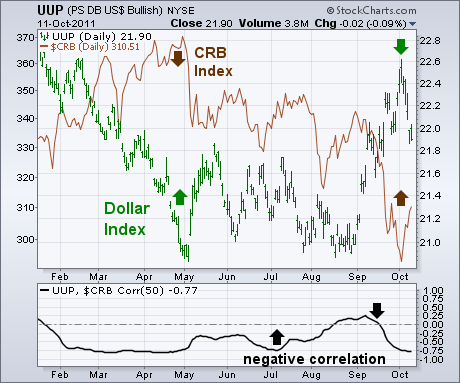
The US Dollar Index ($USD) was hit hard this week with a 2.2% decline. Weakness in the Dollar buoyed oil and stocks, which have been negatively correlated with the greenback. Dollar weakness and Euro strength is also associated with the risk-on trade... Read More
ChartWatchers October 02, 2011 at 08:56 AM
THINGS NON-MEMBERS ASK ABOUT - Yes, we do have monthly charts. Yes, we do allow you to create charts that are longer than 3 years. Yes, you can see the data that makes up each chart. Yes, our charts can be automatically updated... Read More
ChartWatchers October 01, 2011 at 09:21 PM
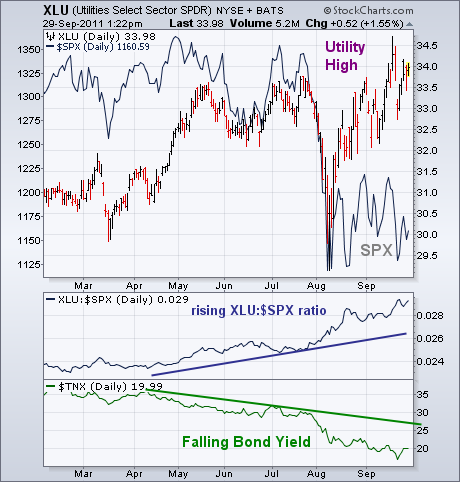
Utilities have emerged as the year's strongest sector. The chart below shows the Utilities Sector SPDR (XLU) trading near a new 52-week high while the S&P 500 (solid line) is closer to a new lows... Read More
ChartWatchers October 01, 2011 at 09:12 PM
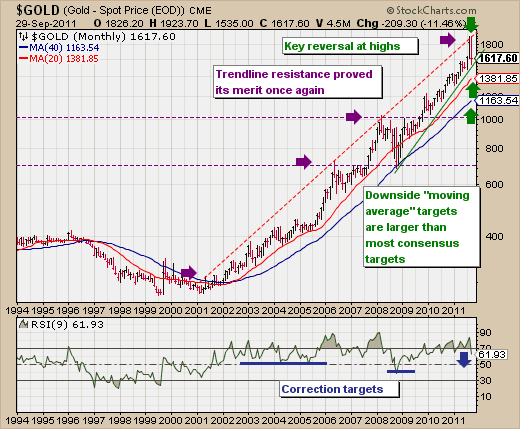
The month of September has not been kind to Gold; and the question before everyone is whether or not gold has seen its highs for an intermediate period or whether a brief pause before higher highs are forged... Read More
ChartWatchers October 01, 2011 at 09:08 PM
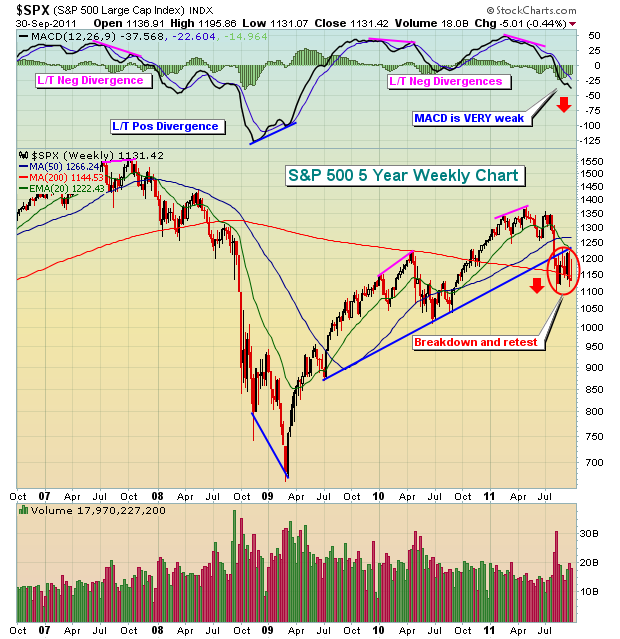
The weekly moving average convergence divergence (MACD) has always been a favorite indicator of mine. It provides a "big picture" outlook of the market and helps me take a step back from the day to day swings of the market... Read More
ChartWatchers October 01, 2011 at 08:33 PM
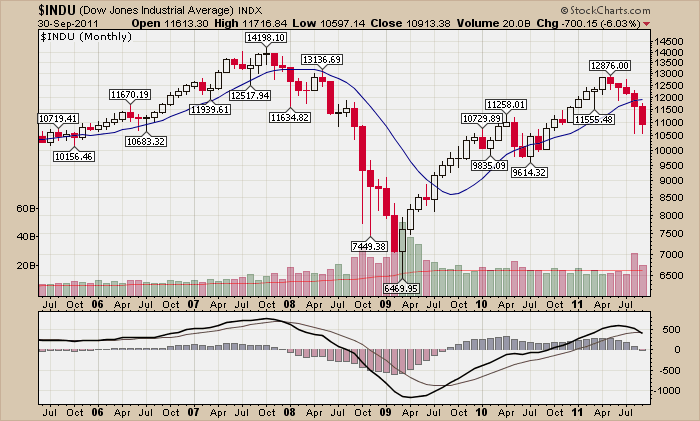
Hello Fellow ChartWatchers! Simpler is usually better and that is definitely true when you are looking for a chart to put the month of September into perspective. Voila! Members can click the chart to see a live version... Read More
ChartWatchers October 01, 2011 at 04:00 PM
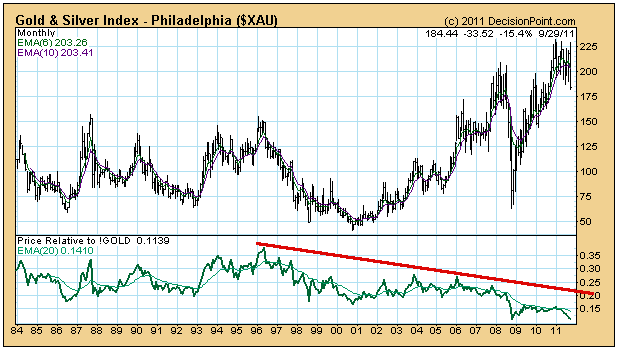
QUESTION: Carl, I have read a lot of articles recently indicating gold miner stocks should go up and outpace gold. So far nothing but a drop in goldminers... Read More
ChartWatchers October 01, 2011 at 07:05 AM
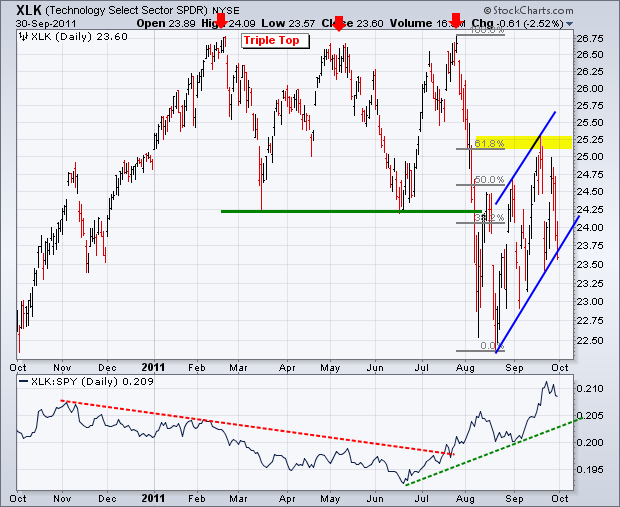
After hitting resistance at a key retracement this month, the Technology ETF (XLK) fell with what looks like a continuation of the bigger downtrend. First, notice that the ETF formed a massive Triple Top that extends from January to July... Read More