ChartWatchers July 24, 2010 at 12:53 PM
DO YOU LIKE US? DO YOU REALLY, REALLY LIKE US? - StockCharts now has an official page on FaceBook that FaceBook users can use to keep up with the latest site developments and articles. Just visit http://facebook... Read More
ChartWatchers July 24, 2010 at 12:45 PM
Hello Fellow ChartWatchers! Are you feeling more bullish now? Last week's rallies have put some needed energy back into the traders that haven't gone on vacation this summer... Read More
ChartWatchers July 24, 2010 at 12:03 PM
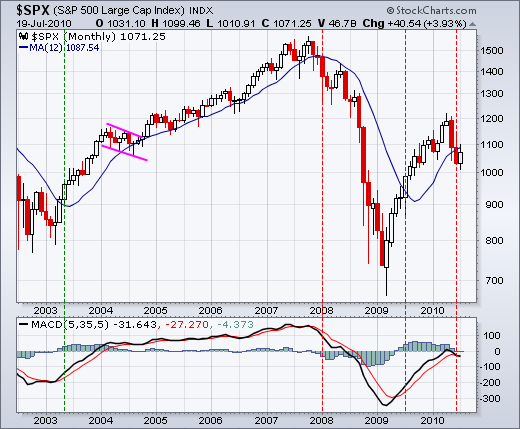
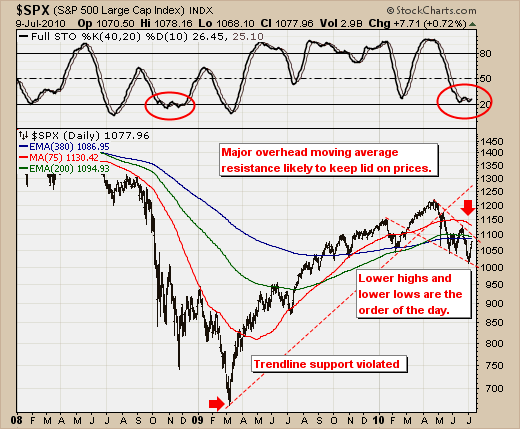
On the monthly chart, the S&P 500 broke below its 12-month moving average for the first time since July 2009. Even though moving average crossovers do not pick exact bottoms or tops, this moving average cross captured the major moves over the last eight years... Read More
ChartWatchers July 24, 2010 at 03:16 AM
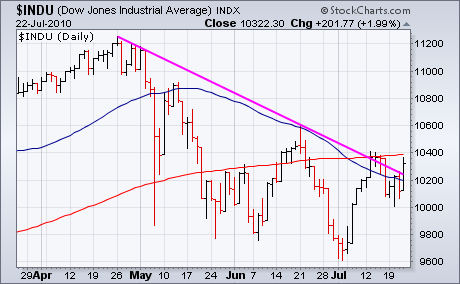
Stocks turned in a strong performance Thursday. The three major stock indexes shown below closed back over their 50-day moving averages. The S&P 500 (Chart 2) and the Nasdaq Composite (Chart 3) did so for the first time since early May... Read More
ChartWatchers July 24, 2010 at 02:48 AM
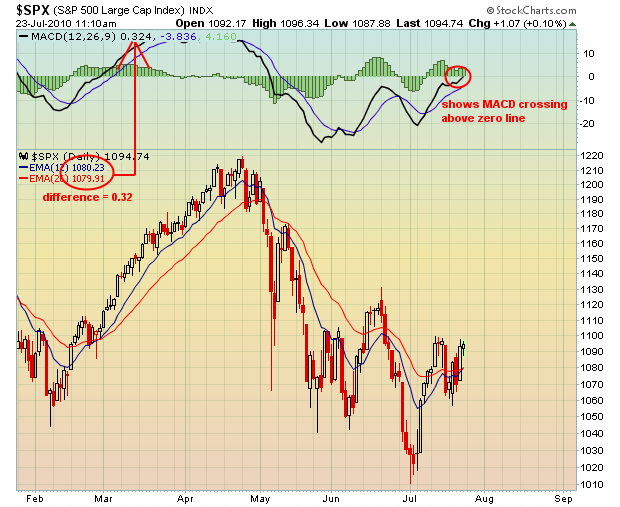
Divergences are among the most misused technical analysis tool anywhere, in my opinion. The first step in successful trading using divergences is understanding both their strengths and their limitations... Read More
ChartWatchers July 23, 2010 at 08:40 PM
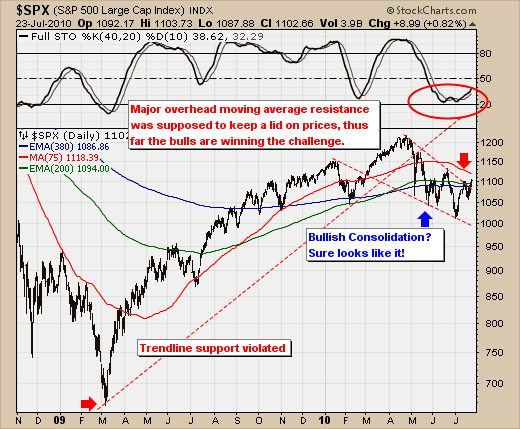
After a horrid 2nd quarter, the S&P 500 is sure making up it's losses at a rapid rate... Read More
ChartWatchers July 23, 2010 at 07:16 PM
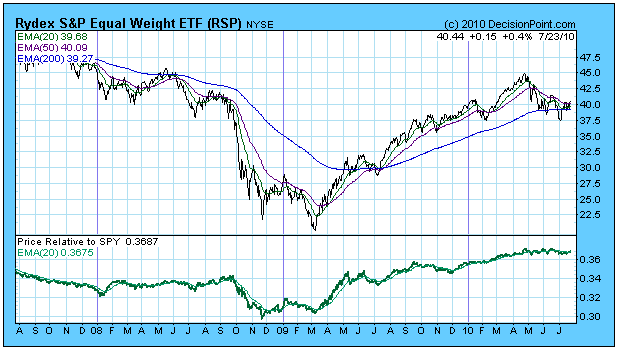
We have added a new page of charts to help us monitor the relative strength of equal-weighted indexes against their capitalization-weighted counterparts. Cap-weighted index values are dominated by the larger-cap stocks in the index... Read More
ChartWatchers July 11, 2010 at 02:58 AM
Hello Fellow ChartWatchers! With the market posting four solid up days over the past week, is now the time to get back in to the market? That's the main topic of this week's newsletter and there are lots of opinions going around right now... Read More
ChartWatchers July 11, 2010 at 02:34 AM
In the life of a technical analyst, a month seems like a week, a week seems like a day and a day seems like minutes. Time flies and so do the charts and various technical patterns. I think it's always a good idea to periodically take a step back and look at the broader picture... Read More
ChartWatchers July 11, 2010 at 02:28 AM
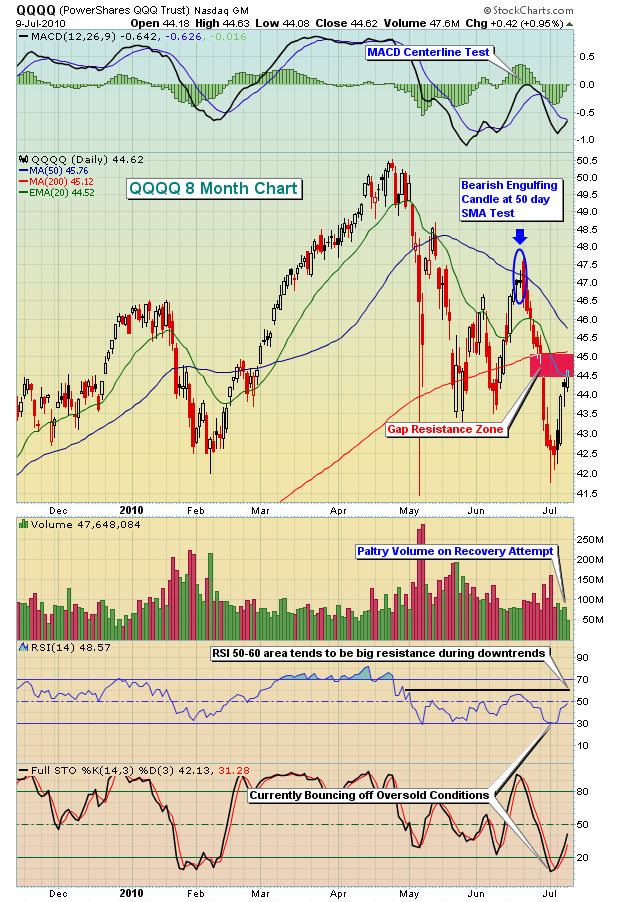
The July 4th fireworks came a bit more belatedly this year as the S&P 500 rose +4.86% in the holiday shortened week. This performance was rather impressive in terms of points and breadth, but certainly not in terms of volume... Read More
ChartWatchers July 11, 2010 at 02:24 AM
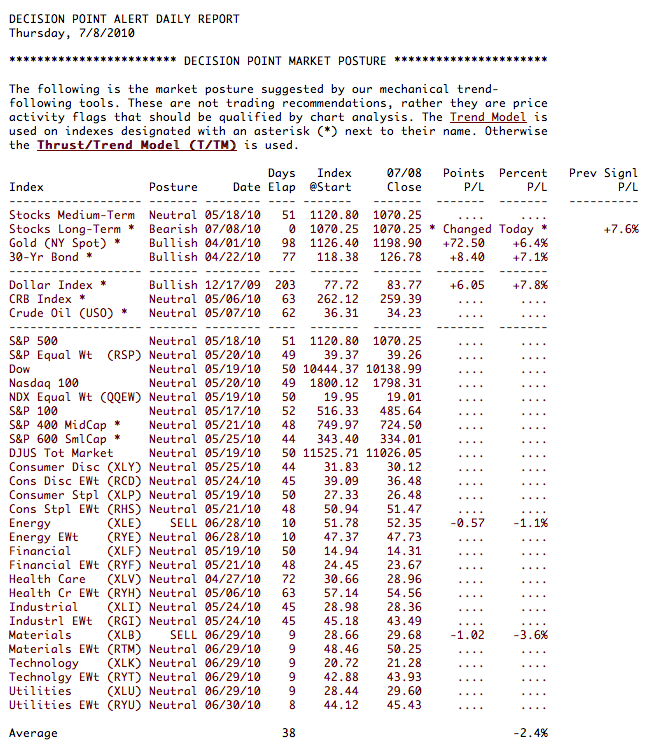
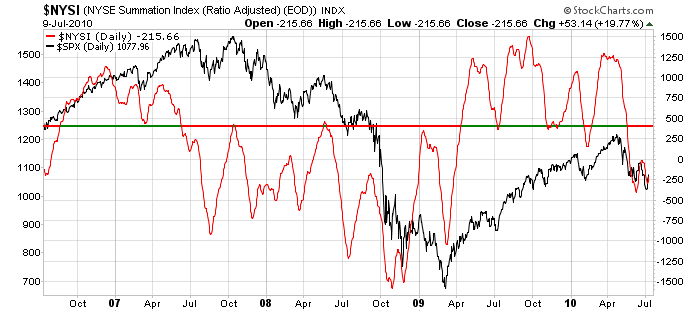
As you can see in our Decision Point Alert Daily Report below our Trend Model has triggered a Long-Term SELL signal for stocks. This occurs when the 50-EMA crosses below the 200-EMA. It has been headed this direction for quite some time so it is not unexpected... Read More
ChartWatchers July 10, 2010 at 07:09 AM
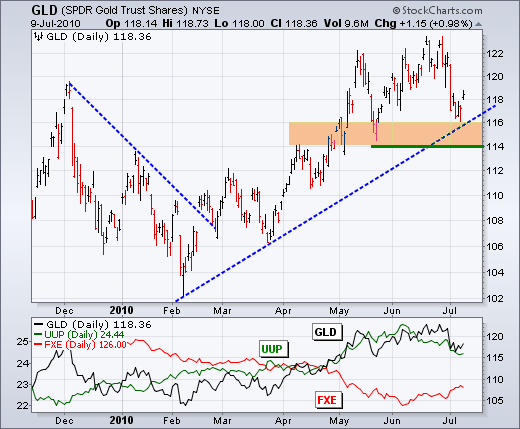
After sharp declines in late June and early July, gold and silver are testing important support zones from their prior lows. The fist chart shows the Gold ETF (GLD) hitting new 52-week highs in late June... Read More