ChartWatchers January 20, 2008 at 11:06 PM
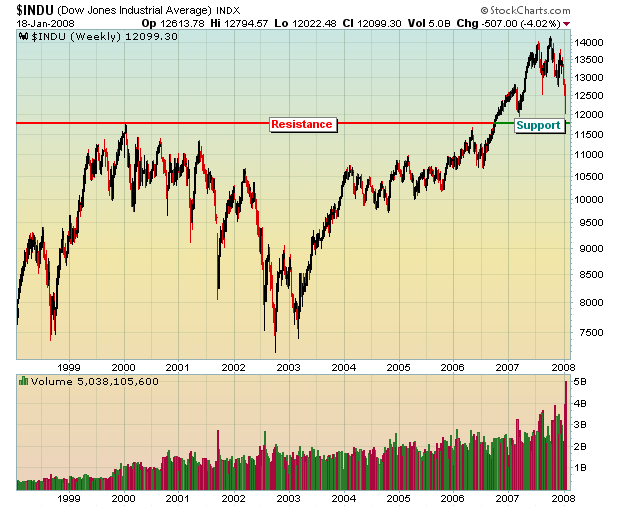
The two most frequently asked questions these days are as follows: (1) Are we in a bear market? (2) Where's the bottom? Let's take them one at a time. A bear market is generally defined as a decline of 20% or more... Read More
ChartWatchers January 20, 2008 at 11:05 PM
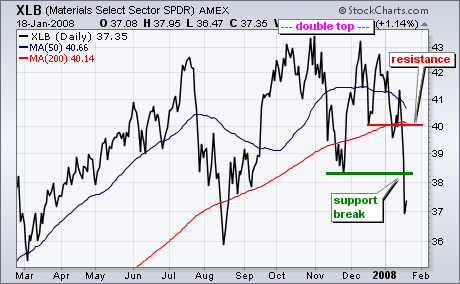
The Materials SPDR (XLB) joined the double top club with a sharp decline this past week. The Finance SPDR (XLF) and Consumer Discretionary SPDR (XLY) started the club with double top support breaks in August. The Russell 2000 ETF (IWM) broke double top support in November... Read More
ChartWatchers January 20, 2008 at 11:04 PM
On January 8 the 50-EMA crossed down through the 200-EMA on the S&P 500 daily chart, generating a long-term sell signal and declaring that we are now in a bear market. This was confirmed this week when the weekly 17-EMA crossed down through the 43-EMA... Read More
ChartWatchers January 20, 2008 at 11:03 PM
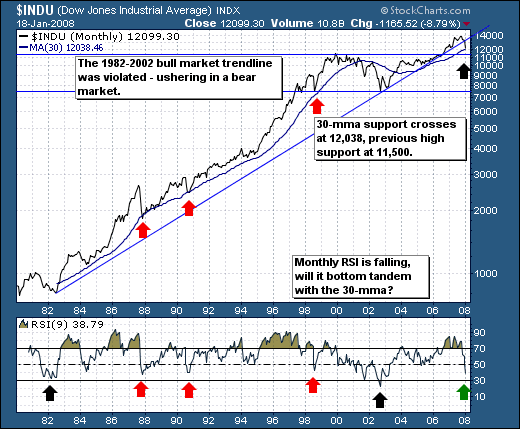
The bull market is over; the Dow Industrials broke below its major bull market trendline extending from the 1982 bear market lows through the 2002 bear market lows... Read More
ChartWatchers January 20, 2008 at 11:02 PM
Here are three things that everyone should do periodically to ensure that your computer works well when using StockCharts.com. Every day we get messages from lots of people that are having problems with their web browser and usually one of these steps will fix the problem... Read More
ChartWatchers January 20, 2008 at 11:01 PM
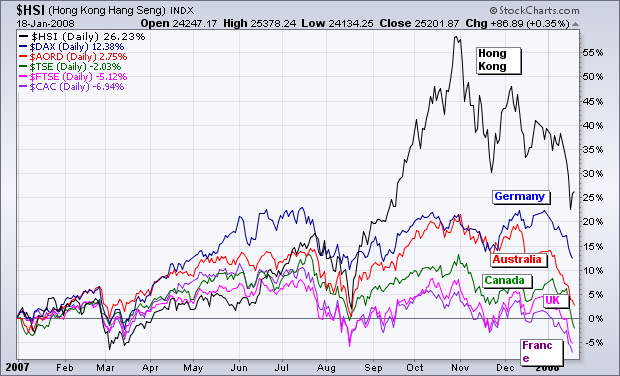
I've expressed reservations before about the recent theory of global decoupling. The reasoning was that foreign markets would remain relatively immune to a major selloff (and possible recession) in the U.S... Read More
ChartWatchers January 20, 2008 at 11:00 PM
Lots of people are doing the Chicken Little thing these days... Read More
ChartWatchers January 06, 2008 at 11:06 PM
We've been following the bond market closely and for good reason. Earnings and interest rates drive the stock market. We are seeing a lot of signs of an economic slowdown, perhaps even a mild recession... Read More
ChartWatchers January 06, 2008 at 11:05 PM
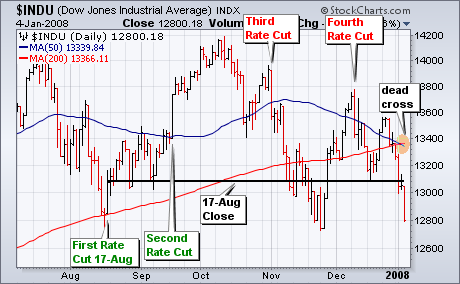
The Fed started cutting interest rates on August 17th with a surprise 50 basis points cut in the Discount Rate. There have been three more rate cuts since 17-Aug, but the Dow Jones Industrial Average has nothing to show for these cuts... Read More
ChartWatchers January 06, 2008 at 11:04 PM
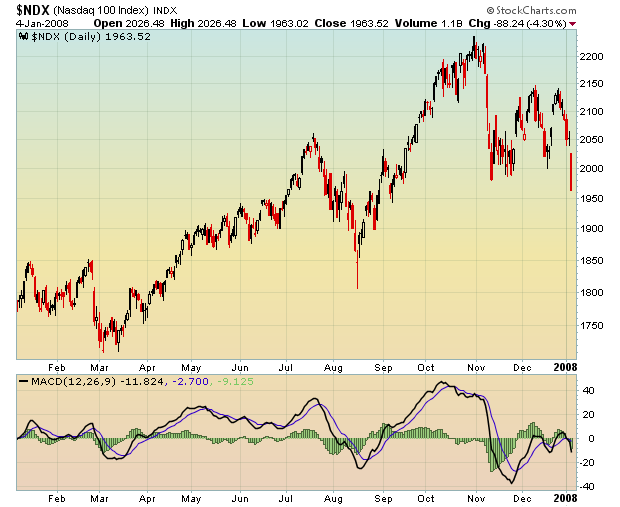
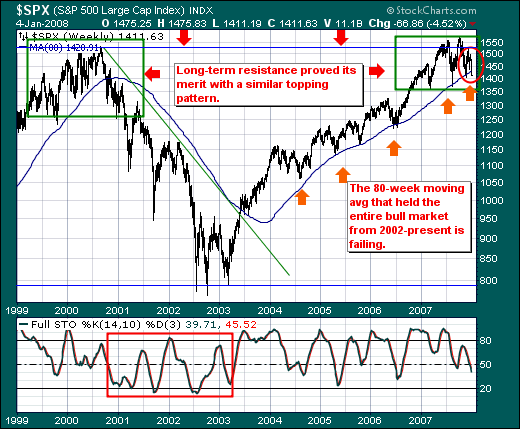
Currently, the stock market is still in the process of retesting the November lows. This process needs to end now or some serious technical damage will be done, specifically the long-term rising trend line is in danger of being decisively violated... Read More
ChartWatchers January 06, 2008 at 11:03 PM
The S&P 500 is off to its worst start to begin a new year since 2000; however, this isn't the larger headline to us... Read More
ChartWatchers January 06, 2008 at 11:02 PM
Just what you wanted right? Actually, this is the "Ticker Rain" that we talked about in the last newsletter. It is finally up on our website at http://stockcharts.com/charts/tickerrain.html... Read More
ChartWatchers January 06, 2008 at 11:01 PM
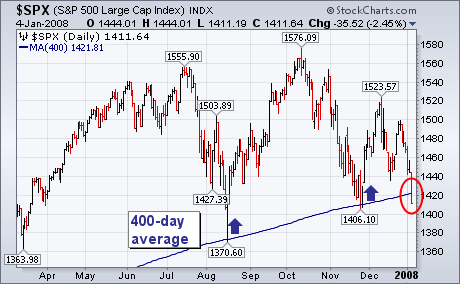
During the August market drop, I wrote about the importance of the 400-day moving average as a major support line. [That line is gotten by converting the 20-month moving average to a daily line. I'll show why we use that line shortly]... Read More
ChartWatchers January 06, 2008 at 11:00 PM
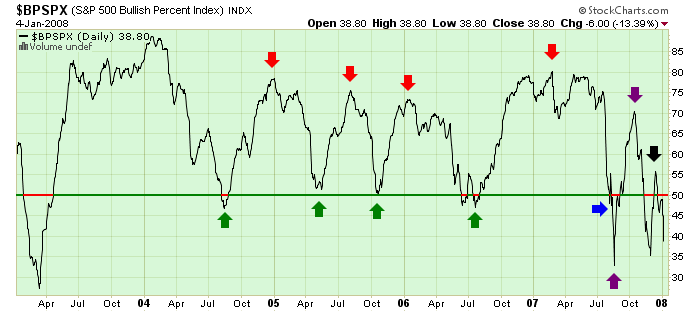
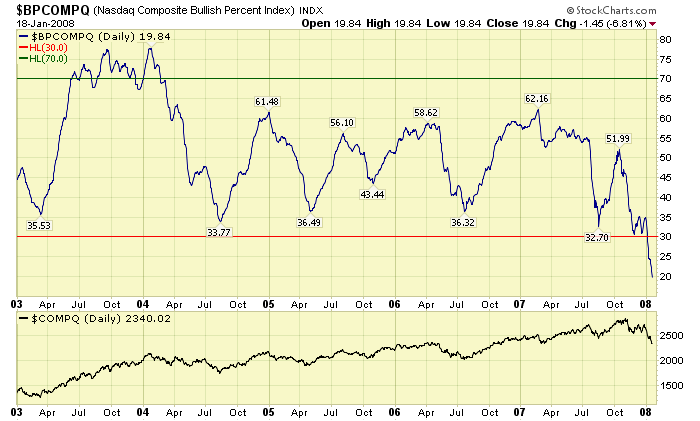
Hello Fellow ChartWatchers! Welcome to 2008! The start of a new year is always a good time to look for the big-picture perspective on things and few things say "Big Picture" better than the Bullish Percent Indices... Read More