ChartWatchers April 21, 2007 at 10:06 PM
Look for Tom's commentary next time... Read More
ChartWatchers April 21, 2007 at 10:05 PM
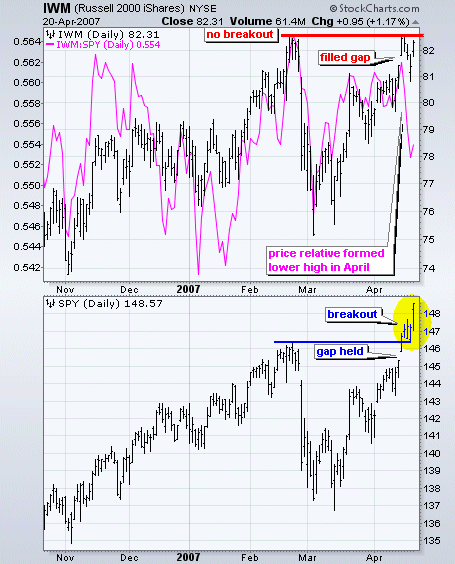
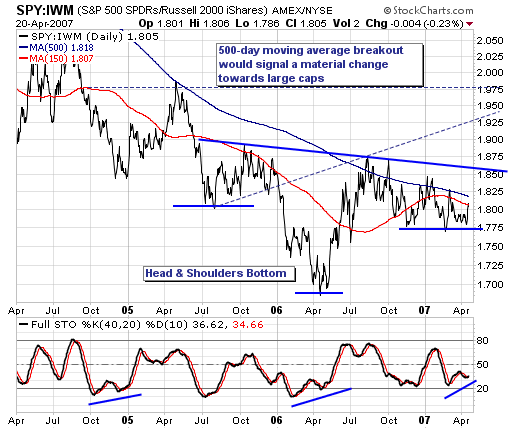
The Dow Diamonds (DIA) moved to a new all time high this past week and the S&P 500 ETF (SPY) recorded a multi-year high. En route to these highs, both exceeded their late February highs and large-caps are showing relative strength... Read More
ChartWatchers April 21, 2007 at 10:04 PM
Back in November 2006 I speculated that the 4-Year Cycle trough had arrived in June/July 2006, and that the implication was bullish for stocks – bullish because we normally expect an extended rally out of those cycle lows... Read More
ChartWatchers April 21, 2007 at 10:03 PM
The positive stock market rally is undergoing significant "rotation" within various indices, which in our opinion is quite important from both an investment and trading perspective... Read More
ChartWatchers April 21, 2007 at 10:01 PM
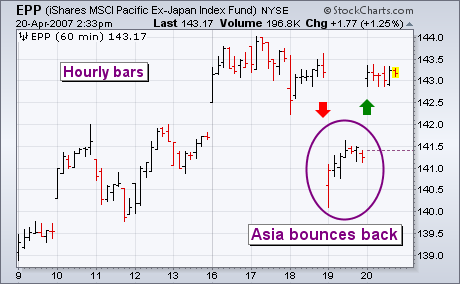
Thursday's 4.5% drop in Chinese stocks caused nervous selling in other Asian markets. By the time the U.S. market opened, however, Europe had already started to recover and initial U.S. losses were modest. By day's end, the Dow had closed at a new record high... Read More
ChartWatchers April 21, 2007 at 10:00 PM

The markets did great this week with the Dow hitting record highs and closing in on 13,000 however almost no one here at StockCharts.com was paying much attention. As most ChartWatchers know, we spent much of the week wrestling with technical glitches... Read More
ChartWatchers April 08, 2007 at 10:06 PM
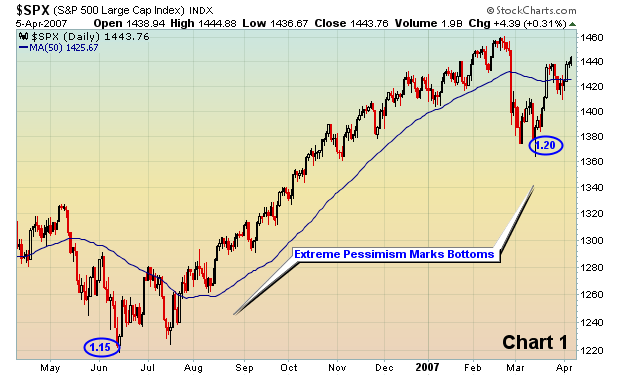
The put call ratio ("PC") is quite simply the total number of put options divided by the total number of call options. These options include both individual equity options and index options. Every day you can monitor the relationship between put options and call options at www... Read More
ChartWatchers April 08, 2007 at 10:05 PM
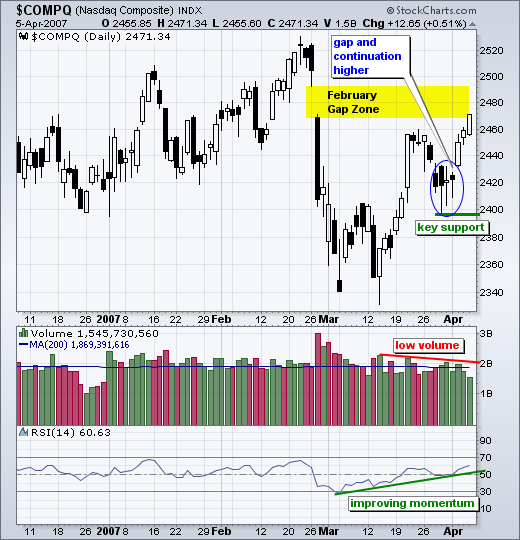
The Nasdaq rally continued into its fourth week with a gap up on Tuesday and move into the late February gap zone. This late February gap started a sharp decline to the March lows and the recovery back above 2460 is quite impressive... Read More
ChartWatchers April 08, 2007 at 10:04 PM
Our Thrust/Trend Model (T/TM) is so-named because it treats bottoms and tops differently – tops tend to be rounded trend changes, and bottoms tend to be formed by sharp changes in direction accompanied by internal up thrusts... Read More
ChartWatchers April 08, 2007 at 10:03 PM
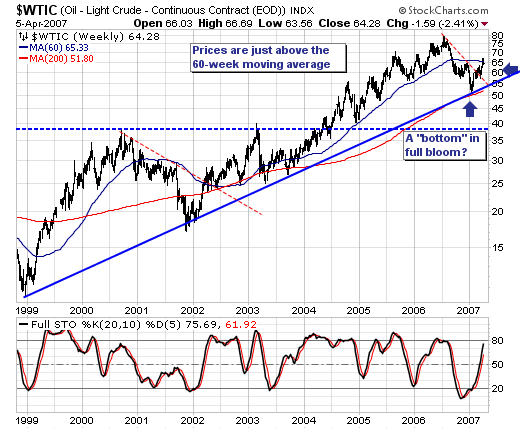
For the past couple of weeks, the markets have focused in upon crude oil prices and their attendant rise given the Iran hostage situation... Read More
ChartWatchers April 08, 2007 at 10:02 PM
Regular readers know that we've been trying to complete a big upgrade to our server room for almost a year now... Read More
ChartWatchers April 08, 2007 at 10:01 PM
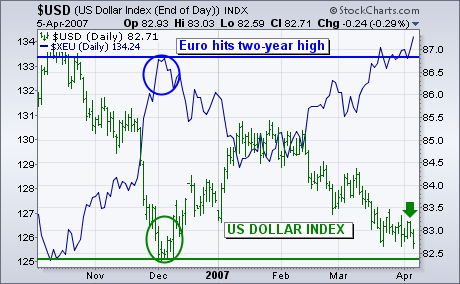
The U.S. Dollar Index fell during the week and is drawing dangerously close to last December's low (green circle). The foreign currency with the biggest influence on the USD is the Euro... Read More
ChartWatchers April 08, 2007 at 10:00 PM
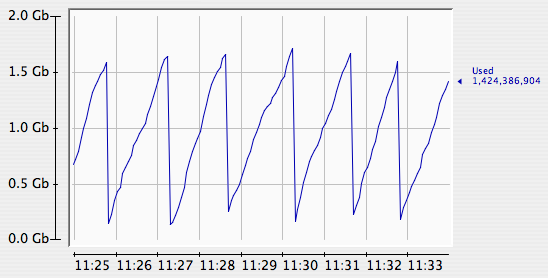
Hello Fellow ChartWatchers! This week I thought we'd look at something different - the charts that matter the most to me personally. Now, brace yourself... these charts are not financial charts. Nope. These are the charts that tell us at an instant how well the StockCharts... Read More