ChartWatchers February 18, 2006 at 11:05 PM
Two weeks ago, I reported waning upside momentum for the Dow Industrials and Dow Transports. In addition, I noted that a Dow Theory non-confirmation was brewing, but a Dow Theory sell signal had yet to register... Read More
ChartWatchers February 18, 2006 at 11:04 PM
In my February 2 article I stated my belief that a medium-term correction is in progress because the PMM Percent Buy Index (PBI) has turned down and crossed down through its 32-EMA. The chart below shows this condition still exists, and I have not changed my mind at this point... Read More
ChartWatchers February 18, 2006 at 11:03 PM
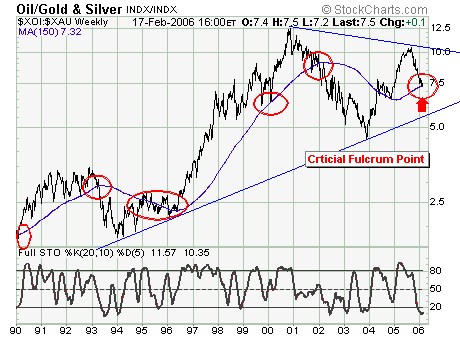
For the longest time, crude oil and gold prices have dominated the news in terms of bullish commodities... Read More
ChartWatchers February 18, 2006 at 11:01 PM
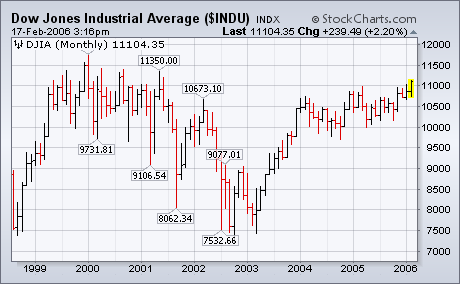
The Dow was the only one of the major averages to reach a new high this week. That continues its new upside leadership that I wrote about last week. With the Dow now above the 11K level, the next potential upside target is its 2001 high at 11350... Read More
ChartWatchers February 18, 2006 at 11:00 PM
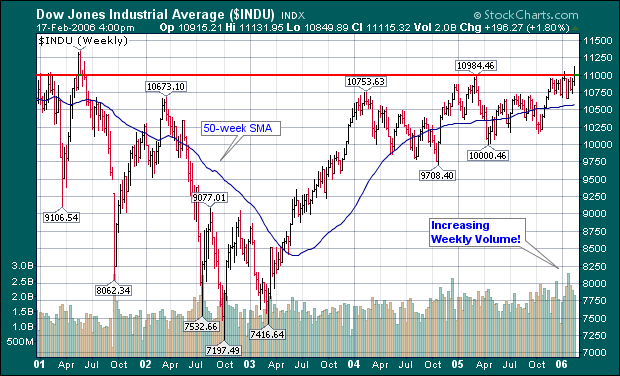
Stocks made a strong statement last week with the Dow Jones Industrials moving above the 11,000 mark decisively for the first time since June of 2001(!)... Read More
ChartWatchers February 05, 2006 at 11:05 PM
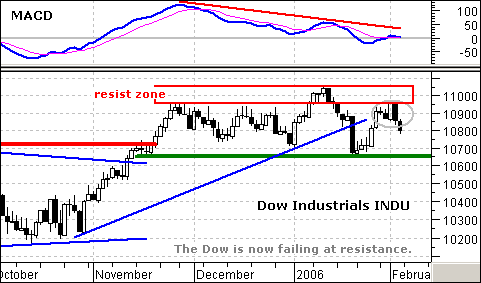
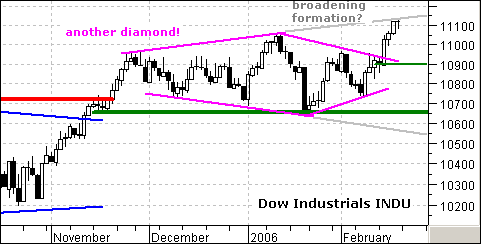
The Dow is meeting staunch resistance around 11000, a level that turned the Average back in December and January. February is getting off to the same start with a big black candlestick on Thursday and 11500 remains the level to beat... Read More
ChartWatchers February 05, 2006 at 11:04 PM
With the market having formed numerous tantalizing tops since the end of November, perhaps the title of this article should say that a correction phase is finally beginning... Read More
ChartWatchers February 05, 2006 at 11:03 PM
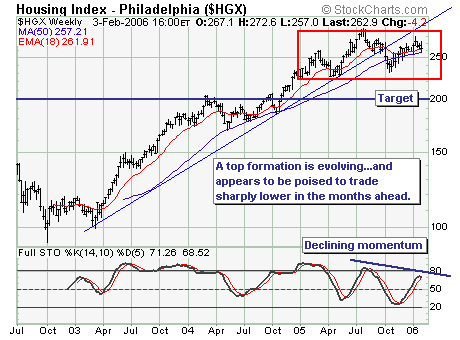
The decline in the housing market is becoming more and more real; however, the housing index has yet to fully reflect the risk of the potential for still slower housing growth numbers. In some cases such as Ryland's (RYL), new home sales were recently below 2004 levels... Read More
ChartWatchers February 05, 2006 at 11:02 PM
NOTHING MUCH GOING ON - Yep, StockCharts.com is pretty quiet this week... Just Kidding! SharpCharts2 Beta 7 is out... Read More
ChartWatchers February 05, 2006 at 11:01 PM
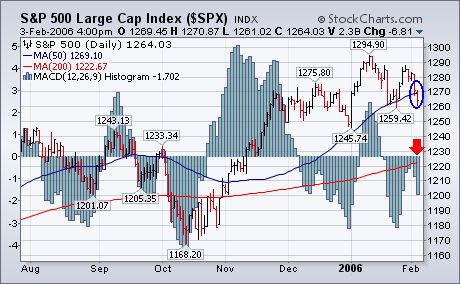
The chart below shows the S&P 500 closing the week below its 50-day moving average. That suggests a further drop toward 1245. The daily MACD histogram bars also paint a short-term negative picture... Read More
ChartWatchers February 05, 2006 at 11:00 PM
Have you tried SharpCharts2 yet? The reception for our new "Beta 7" version of SharpCharts2 has been incredible! More people have created more great looking SharpCharts2 charts in the past 3 days than ever before... Read More