ChartWatchers October 16, 2005 at 10:05 PM
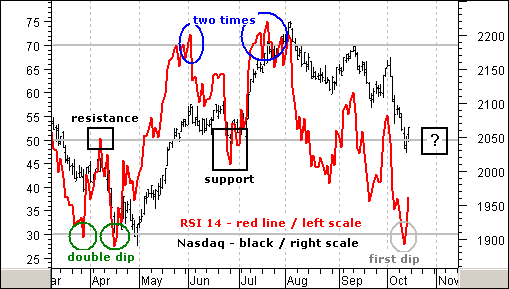
This week 14-day RSI for the Nasdaq became oversold (below 30) for the first time since April (gray oval). Even though securities can become oversold and remain oversold, the odds of a bounce increase with oversold conditions... Read More
ChartWatchers October 16, 2005 at 10:04 PM
The Price Momentum Oscillator (PMO) is an expression of internal strength for a given price index... Read More
ChartWatchers October 16, 2005 at 10:03 PM
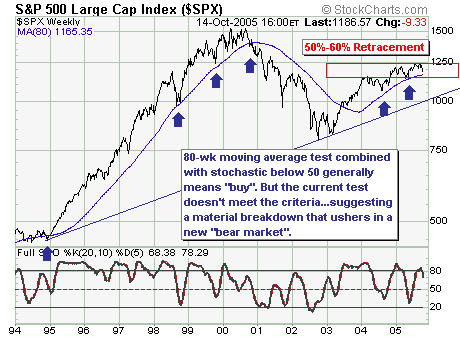
Today, the simple technical picture is breaking down in our opinion. If we look back to 1994, we find the 80-week moving average has been an excellent swing trading tool as it holds the data as near perfect as can be expected... Read More
ChartWatchers October 16, 2005 at 10:01 PM
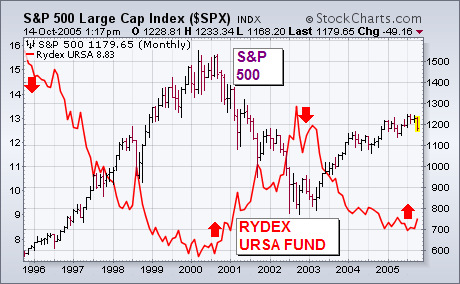
My Wednesday message on bear funds wrote that they should be used as trading vehicles and not as a long-term investment. One of our readers asked why. That's because the market has a history of rising more often that it falls... Read More
ChartWatchers October 16, 2005 at 10:00 PM
The markets are getting very interesting these days! Last week saw some big declines that were mostly erased by Friday's rally... Read More
ChartWatchers October 02, 2005 at 10:05 PM
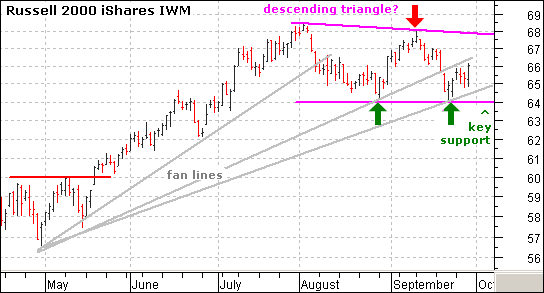
The Russell 2000 ETF (IWM) has two potentially bearish patterns working that would be confirmed with a support break at 64 (645 for the Russell 2000). Confirmation is the key with both patterns. In fact, confirmation is the key to most patterns... Read More
ChartWatchers October 02, 2005 at 10:04 PM
This chart of gold has some interesting technical features. First, there is the parabolic rise to $850 in 1980, which culminated in the inevitable blowoff and collapse... Read More
ChartWatchers October 02, 2005 at 10:03 PM
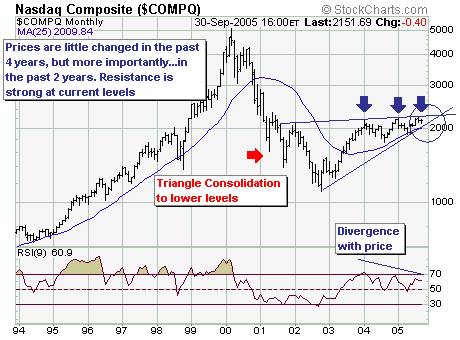
Taking a long-term gander at the Nasdaq Composite, I think is very clear that the time is running out for prices to rise much further than they have at present... Read More
ChartWatchers October 02, 2005 at 10:02 PM
HURRICANE RELIEF FROM STOCKCHARTS - Thanks to the support of our subscribers, StockCharts.com is donating over $20,000.00 to the Red Cross for its hurricane relief efforts for the month of September. We have also pledged a similar amount for the month of October - $5... Read More
ChartWatchers October 02, 2005 at 10:01 PM
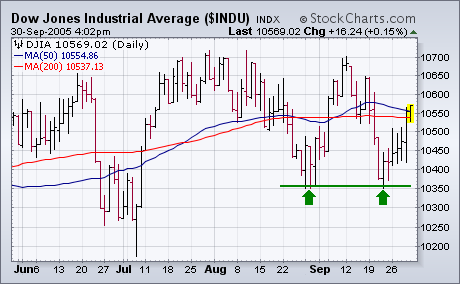
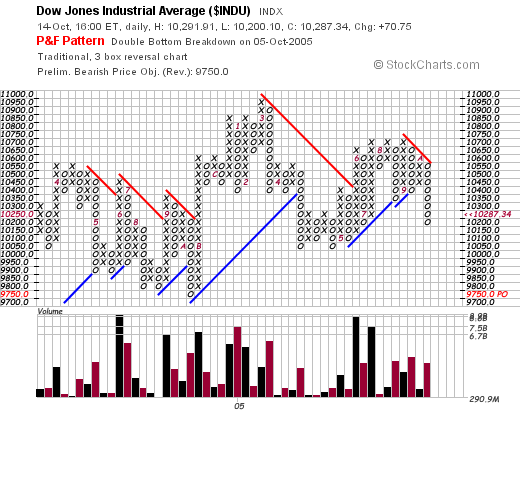
MARKET AVERAGES CLOSE BACK OVER 50-DAY LINES... The market had a lot thrown at it this month. A spike in energy prices, plunging consumer confidence, and rising long-term interest rates... Read More
ChartWatchers October 02, 2005 at 10:00 PM
This week, John reviews the market's recent performance in light of all the economic changes we've been seeing, Richard breaks out a new triangle pattern, Carl takes an in-depth look at gold, and Arthur Hill looks at the Russell 2000. Here we go.... Read More