ChartWatchers August 21, 2004 at 10:05 PM
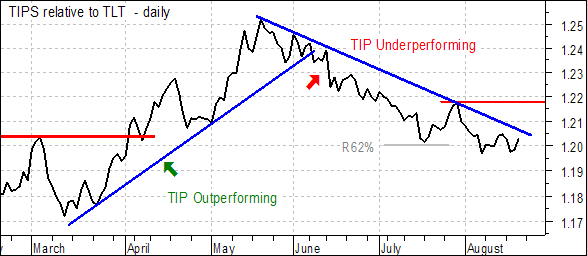
The TIP/TLT price relative serves as a good proxy for inflationary fears or expectations. TIP is the iShares TIPS Bond (TIP), which is based on the US Treasury's inflation indexed bonds. TLT is the iShares 20+ Year Treasury Fund (TLT), which is not hedged against inflation... Read More
ChartWatchers August 21, 2004 at 10:04 PM
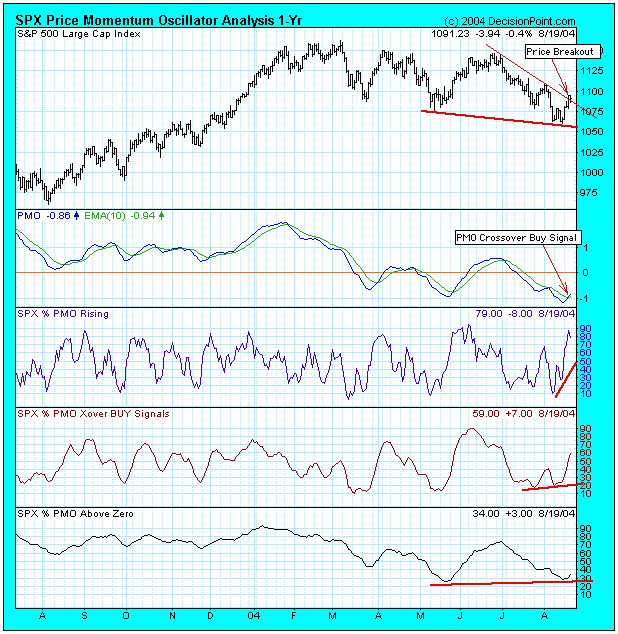
We can't know the full potential of this rally, but there is abundant evidence that we have a solid bottom, and that we are seeing a rally that has at least the potential to move back to the top of the trading range... Read More
ChartWatchers August 21, 2004 at 10:03 PM
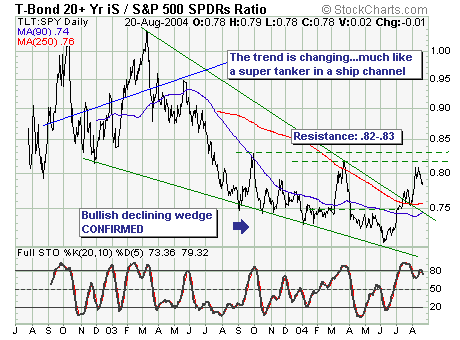
This past week showed stocks higher; their largest weekly gain in nearly 10 months. And, it did so within the context of sharply higher oil prices. By and large, this has set the tone for stocks to potentially move to new highsor so we are to believe... Read More
ChartWatchers August 21, 2004 at 10:02 PM
STRAP ON YOUR HELMETS! - As we've been telling you, this coming week is our big change over to the ThomsonOne Data Feed. We've tested and simulated and fine-tuned things to death but starting on Monday we'll begin the changeover for real... Read More
ChartWatchers August 21, 2004 at 10:01 PM
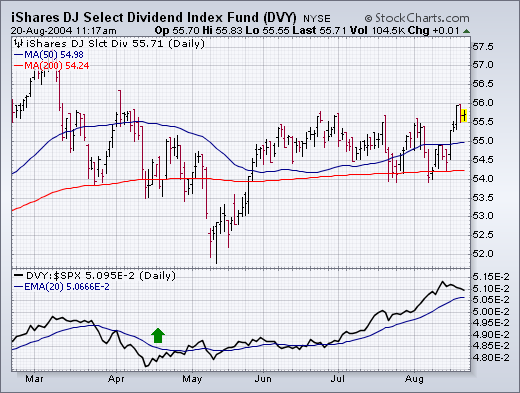
GOING FOR DIVIDENDS... A falling stock market -- along with falling bond yields -- should make dividend paying stocks more attractive. And that appears to be the case... Read More
ChartWatchers August 21, 2004 at 10:00 PM
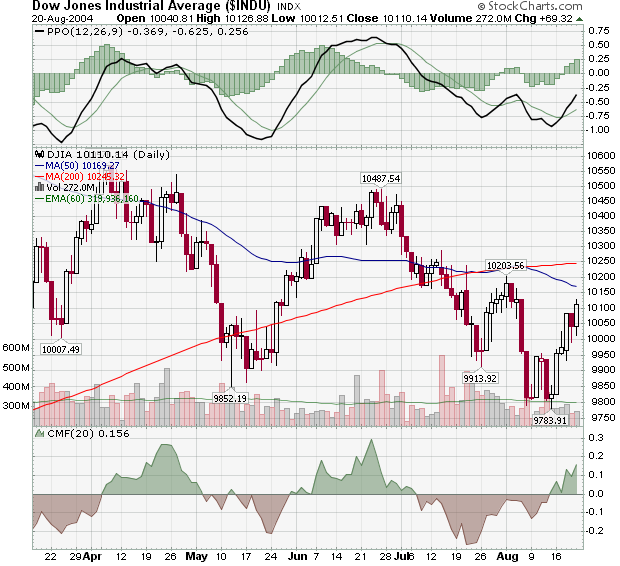
Since setting a new low of 9783 last Friday, the Dow moved higher during four of the last five days and is now approaching the 10203 peak that it set back at the start of August... Read More
ChartWatchers August 07, 2004 at 10:05 PM
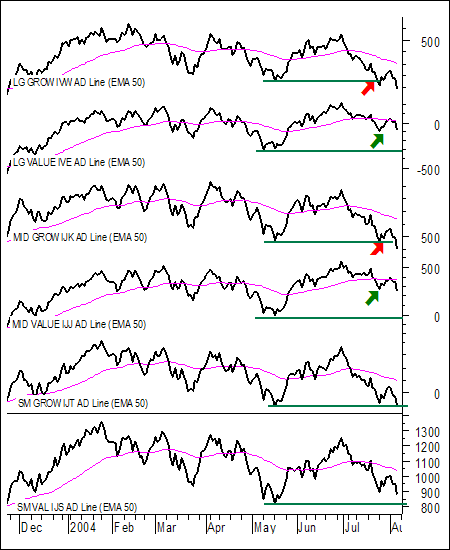
The AD Line is a cumulative measure of advances less declines within a given group of stocks. For example, the S&P Large-Growth ETF (IVW) has 335 stocks... Read More
ChartWatchers August 07, 2004 at 10:04 PM
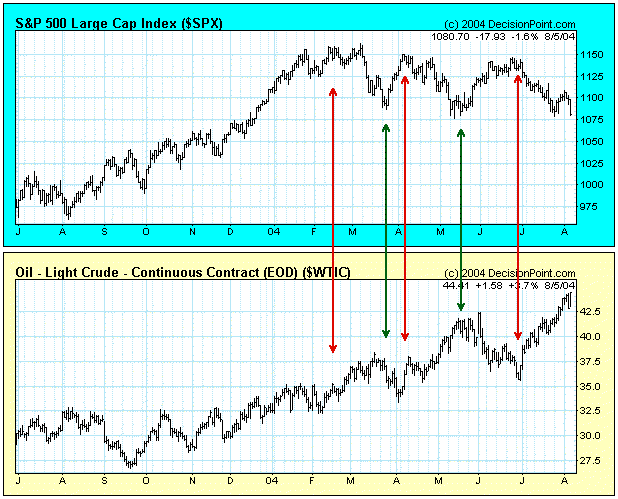
Recently, the price of crude oil has taken the spotlight as having a major influence on the price of stocks... Read More
ChartWatchers August 07, 2004 at 10:03 PM
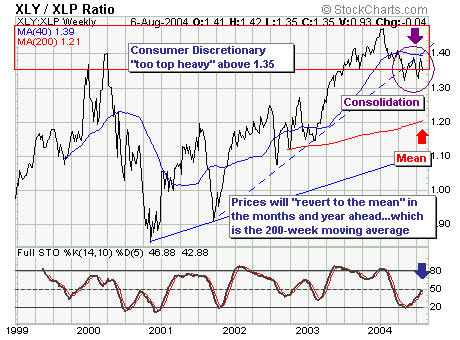
The weakness over the past several months is stark, which was made "more so" over the past two-day decline in all the major indices due to rising energy prices as well as a "punk" employment report... Read More
ChartWatchers August 07, 2004 at 10:02 PM

DATA FEED UPDATE - We're continuing to prepare for our upcoming data feed transition which we mentioned several editions ago. At this point, the new hardware is in place and working well and our testing is almost complete... Read More
ChartWatchers August 07, 2004 at 10:01 PM
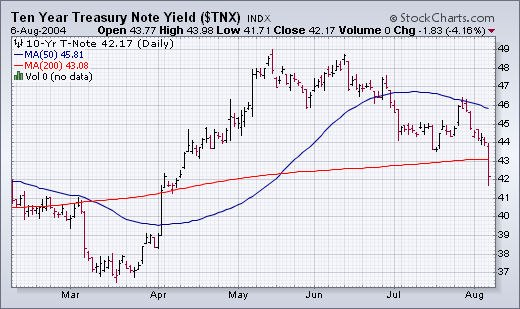
DROP IN BOND YIELDS HURTS DOLLAR, HELPS GOLD... Bond prices surged on Friday's weak job report. As a result, the yield on the 10-Year Treasury note tumbled to a four-month low and ended below its 200-day moving average (Chart 1). The sharp drop in U.S... Read More
ChartWatchers August 07, 2004 at 10:00 PM
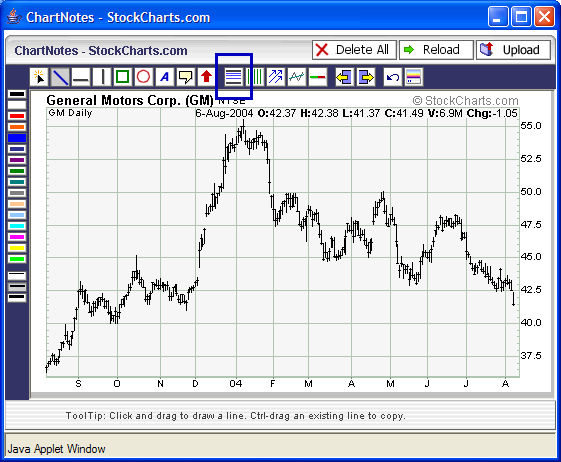
The major markets sold off dramatically at the end of the week due, so we are told, to wild speculation in the oil market. The Dow closed at 9815 which is significant because it is less that the 9852 low that it set back in May... Read More