- Bull Market Affirmed.
- Short-term Twilight Zone.
- Index Table Remains Bullish.
- YouTube Video.
- Small-cap Breadth Remains Weak.
- IWM: Bearish Trend line Break or Bull Wedge?
- Sector Table Remains Bullish.
- 83 Stocks in Strong and Steady Uptrends.
- Art's Charts ChartList Update.
... Bull Market Affirmed
... The S&P 500 advanced some 10% in six weeks (mid June to early July) and hit new all time highs. The new all time highs simply affirm the pre-existing uptrend and the index is a bit extended short-term. This does not guarantee a pullback or correction, but it does increase the chances of a correction. Keep in mind that corrections can come in different forms. More on that later. For now, the 20-day SMA is above the 200-day SMA, price is well above the 200-day SMA and the long-term trend is clearly up for the S&P 500. We are in a bull market.
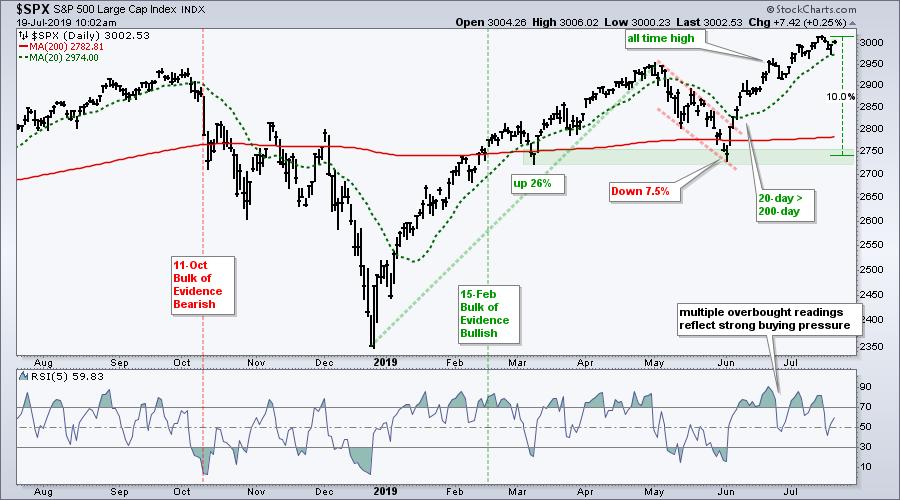 S&P 500 Bull Market Affirmed
Short-term Twilight Zone
Corrections can form as pullbacks (price) or sideways consolidation (time). Sometimes we get a little a both (think falling flag/wedge). It is actually a little early to be thinking about correction targets because SPY hit a new high on Monday. The decline over the last few days is still quite minor and fits with the other short-term pullbacks, which lasted 3-4 days (blue lines). Should this pullback extend, I would mark the first Reversal Alert Zone (RAZ) in the 287-290 area (blue zone). This zone is marked by broken resistance turned support (red zone), support from the June lows (blue zone), the rising 50-day SMA (gray line) and the 38.2-50% retracement zone.
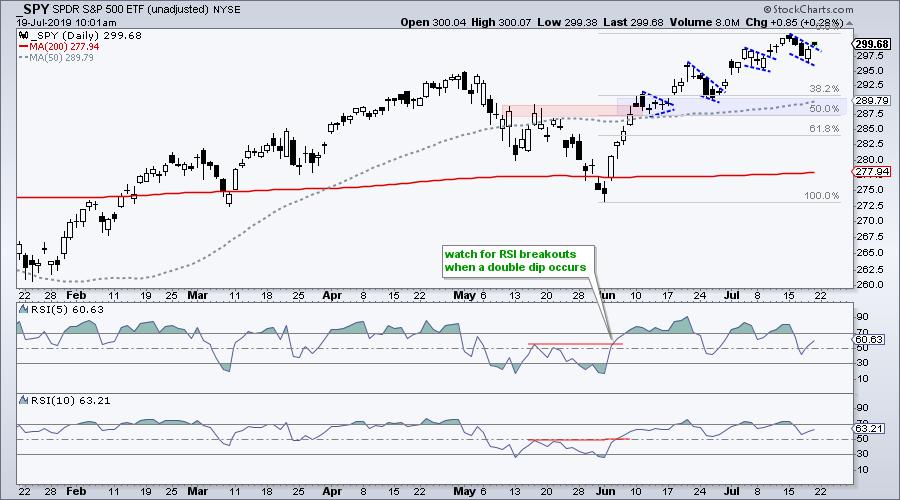 SPY Correction Targets
It is also too early for short-term mean-reversion opportunities. The indicator windows show RSI(5) and RSI(10) above 30. RSI(5) is more sensitive than RSI(10). It is hard to say which one is better. RSI(5) triggered a great mean-reversion signal in early March, but there was a double dip in both indicators in May-June. Chartists can look for RSI breakouts when there is a double dip.
Despite a bull market environment, the S&P 500 is short-term extended after a big advance in six weeks and not short-term oversold for a mean-reversion opportunity. This puts the index in a bullish twilight zone of shorts: bullish, but ripe for a correction. Time to sit tight.
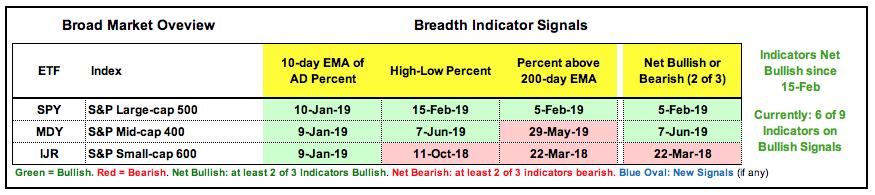
Index Table Remains Bullish
The index table remains unchanged and net bullish (since February 15th). Six of the nine indicators are on bullish signals and all three S&P 500 indicators are on active bullish signals. No matter what inning, the bull market is not over until the 800-pound gorilla cries uncle and the S&P 500 is still showing broad strength.
YouTube Video
This week's video was produced on Thursday and featured in On Trend. This video features the correction targets, the breadth table overview, sector rankings based on the price charts and Reversal Alert Zones in XLE and oil.
The State of the Stock Market
Small-cap Breadth Remains Weak
The chart below shows the S&P Small-Cap 600 with the three breadth indicators. The 10-day EMA of AD Percent triggered bullish in early January and this signal has yet to be reversed (bullish breadth thrust). High-Low Percent triggered bearish in October and this signal has yet to be reversed because new highs are lagging (not many strong uptrends). The %Above 200-day EMA turned bullish in mid February, but flipped back to bearish in mid March (not enough uptrends). Thus, two of the three indicators remain on active bearish signals.
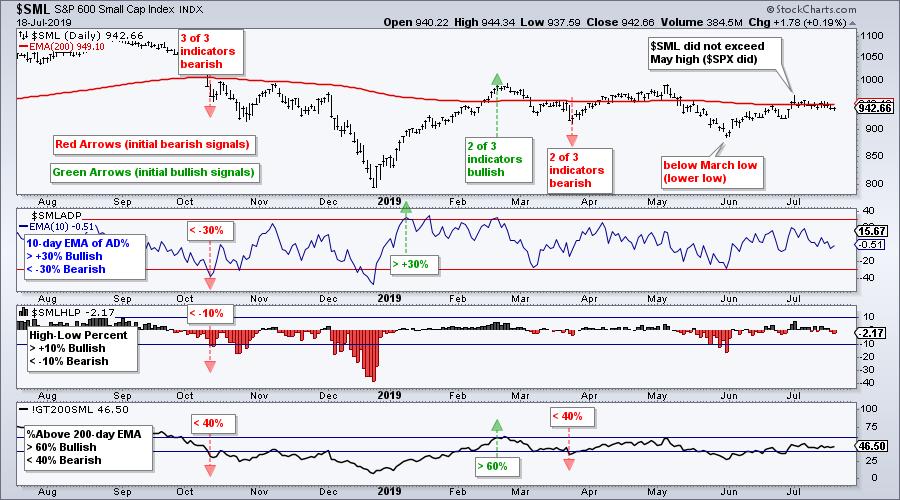 Small Cap Breadth Remains Weak
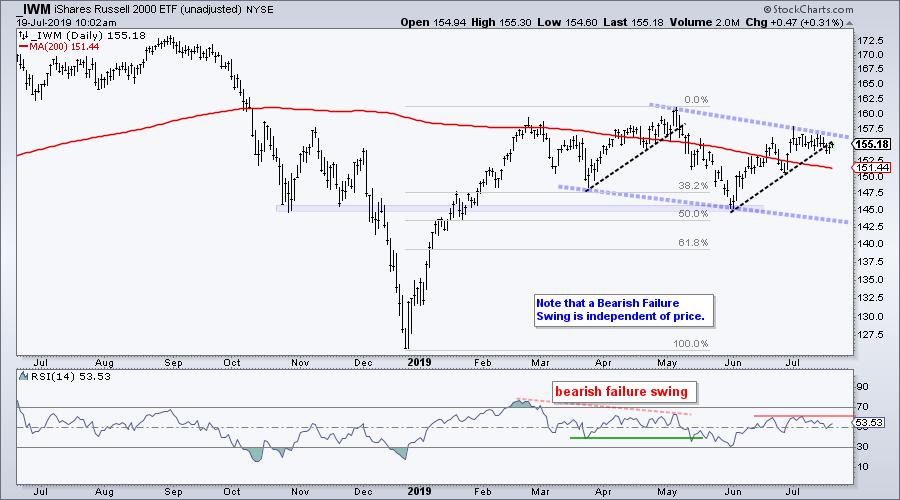
IWM: Bearish Line Break or Bull Wedge?
The Russell 2000 iShares (IWM) surged from 125 to 157 and then went nowhere for the last five months. The ETF has moved above/below the falling 200-day SMA with a slight downward drift (blue lines). This could be just a big correction and a breakout at 157 would be quite positive for small-caps. For now, however, the ETF is seriously underperforming and just broke the June trend line with a decline this week. The immediate swing is down.
 IWM Going Nowhere
The indicator window shows RSI with a Bearish Failure Swing, which is independent of price and has four parts. First, RSI exceeds 70. Second, RSI declines and bounces. Third, the bounce fails to exceed 70 (hence the bearish failure swing). Fourth, RSI moved below the intermittent low. This signal remains active and RSI needs to clear 60 to negate this signal.
The next chart shows daily candlesticks with RSI(5) and RSI(10), neither of which has become short-term oversold. The ETF formed a falling wedge in July and this wedge defines the short-term downtrend, which is also within a bigger downward drift (red lines). A break above 156.5-157 would reverse the downtrend/drift and be quite positive for small-caps.
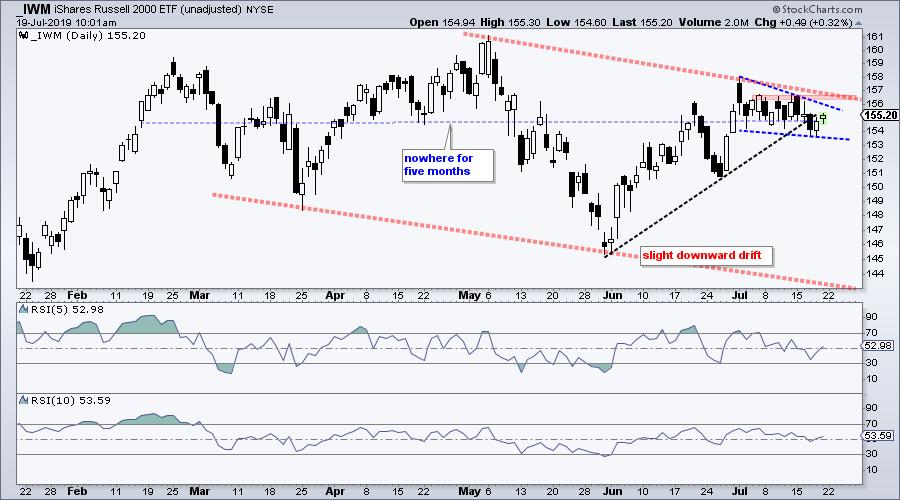 IWM Breakout Level to Watch
Keep in mind that the onus remains on the bulls to prove the bears otherwise for small-caps. Relative weakness, the downward drift and falling wedge are bearish until proven otherwise.
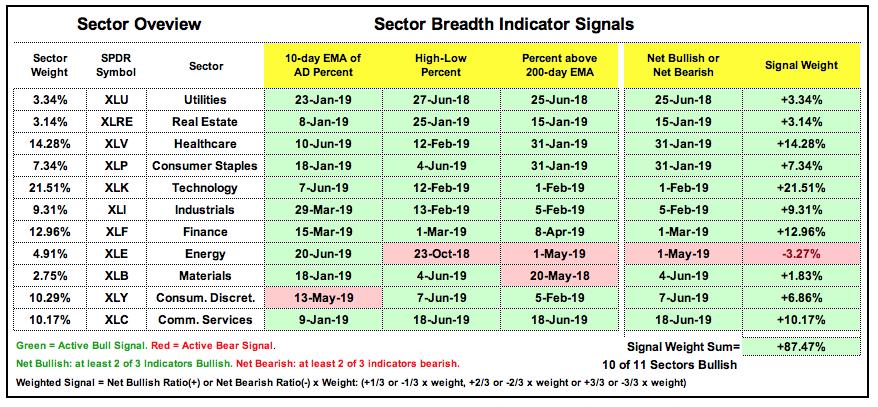
Sector Table Remains Bullish
There is no change in the sector table, except for the sort. Instead of sorting the table by sector weight with the biggest at the top, I sorted by the signal date with the oldest signals at the top. XLU turned net bullish in June 2018 and has the longest active signal by far. XLRE, XLV and XLP triggered bullish in January, while XLK and XLI triggered bullish in early February. As you can see, six of the eleven sectors have been net bullish since early February and these are the most stable. XLE remains on a bearish signal and the weakest by far.
Stocks in Strong and Steady Uptrends
The first comma separated list is for stocks in the S&P 500 that are in strong and steady uptrends. These were found using the RSI-Aroon scan and scrolling through 100s of charts this week. These stocks could be part of a trend-momentum portfolio or part of a watchlist (waiting for your setup). You can easily copy these symbols and add them to a ChartList (see the 4:00 minute mark in the video on this support page).
Stocks in S&P 500: ABT ,AEE ,AEP ,AIV ,AJG ,AZO ,BLL ,BSX ,CCI ,CDNS ,CHD ,CINF ,CMCSA ,DG ,DHR ,DIS ,DRI ,HCP ,HSY ,INTU ,IQV ,KMB ,MA ,MCD ,MRK ,MSFT, MSI ,ORLY ,PEP ,PG ,PYPL ,RSG ,SBAC ,SBUX ,TMO ,TMUS ,TSCO ,ULTA ,V ,VRSN ,VTR ,WELL ,WM ,YUM
Stocks not in the S&P 500: ACIW ,ARGO ,AYX ,BCE ,BRC ,CABO ,COUP ,CRVL ,CYBR ,DENN ,EEFT ,EHTH ,EVOP ,FATE ,GIL ,GLDD ,IBN ,IIIV ,KDP ,KL ,KRYS ,KTOS ,LHCG ,LII ,MDB ,NVS, PAYS ,PLNT ,RNR ,SMPL ,TEAM ,TRI ,TTD ,TWLO ,WDAY ,WING ,WK ,WPC
Art's Charts ChartList Update
The Art's Charts ChartList has been updated with 30 curated stock charts. These charts were selected based on observations this week and the RSI-Aroon chart scan in this System Trader article. Some charts remain from week to week and some change. The idea is to provide a curated list of stocks to watch for the week(s) ahead.
Semiconductor equipment stocks remain strong overall Here are ten: AMAT, LRCX, TER, ASML, KLAC, MKSI, BRKS, ENTG, ACMR. AMAT was on last week's list and I am adding Brooks Automation this week as the stock broke out of a wedge in June and this breakout is largely holding.
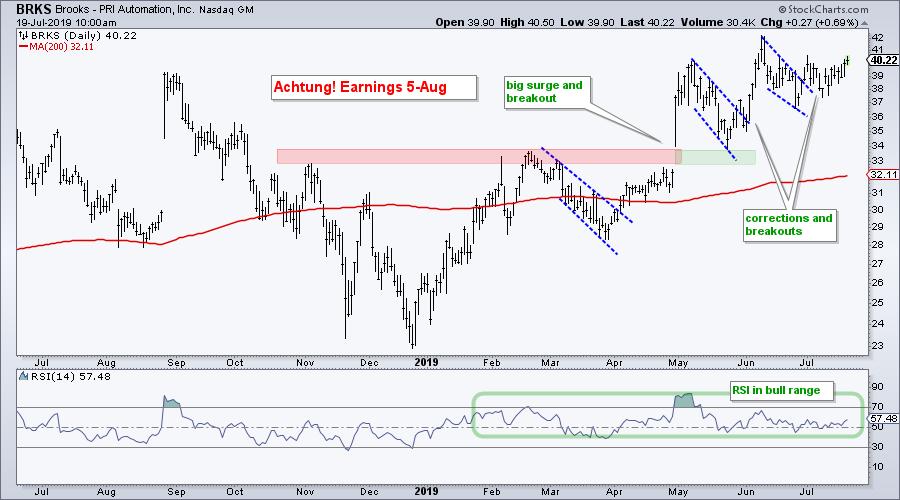 BRKS
BRKS
Campbell Soup (CPB) is part of the consumer staples sector and this is the strongest sector in the market right now. The stock broke resistance levels in early March and early June. There was a pullback in June and a falling flag breakout in early July.
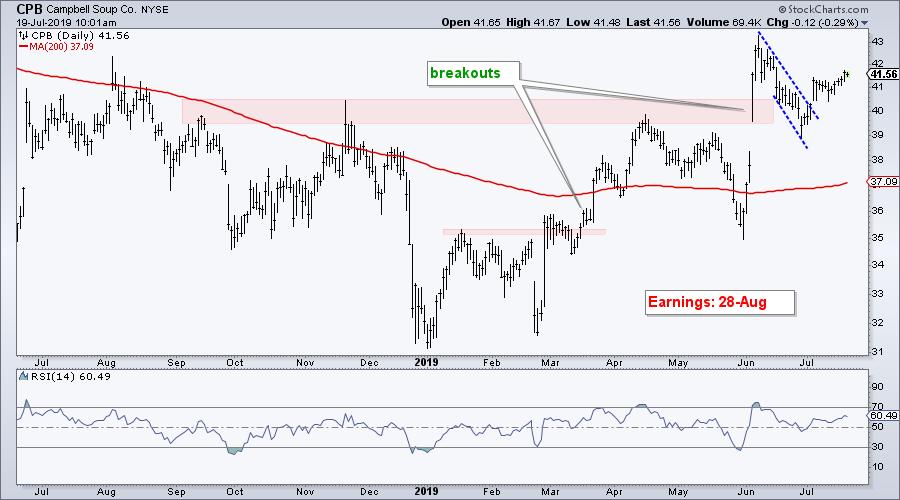 CPB
CPB
Cree (CREE) is part of a strong semiconductor group. The stock broke out earlier this week and is above its rising 200-day. The May-June decline looks like a bullish correction (falling wedge) and a breakout in the 61.5 area would be bullish.
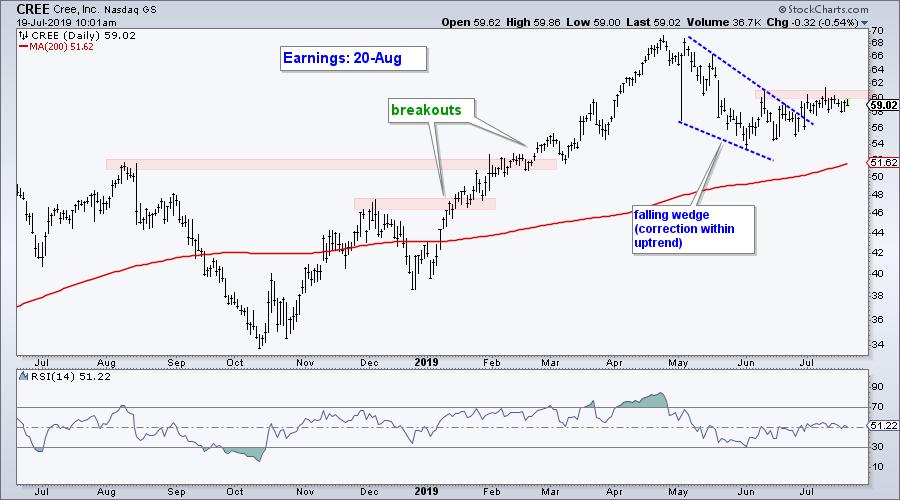 CREE
CREE
Click here for the Art's Charts ChartList
Questions, Comments or Feedback?
Email: arthurh(at)stockcharts.com
Twitter: @arthurhill
Choose a Strategy, Develop a Plan and Follow a Process
Arthur Hill, CMT
Chief Technical Strategist, TrendInvestorPro.com
Author, Define the Trend and Trade the Trend
Want to stay up to date with Arthur's latest market insights?
– Follow @ArthurHill on Twitter